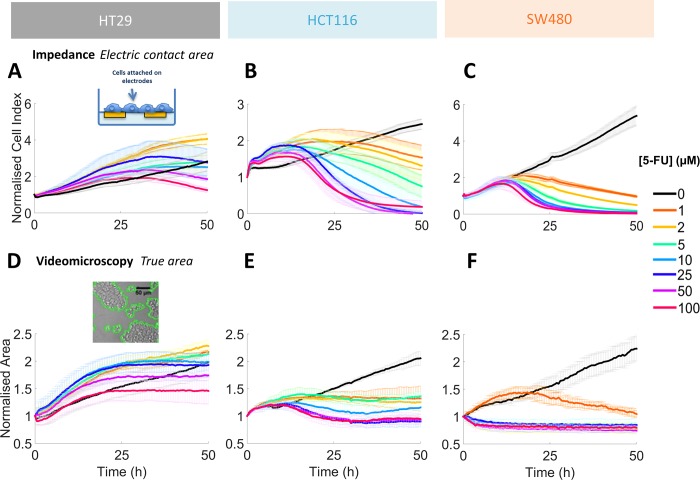
Fig 8. 2D real time growth analysis.
(A-C) Time series of the Cell Index obtained by RTCA impedance assay for the three CRC cell lines after 5-FU treatment administrated at initial time ([5FU] ranging from 0 to 100 μM, see colour code on the right). (D-F) Time series of the normalized cell area obtained by the videomicroscopy assay for the three CRC cell lines after 5-FU treatment administrated at initial time. Error bars: SD. Results from three distinct experiments in triplicate conditions.

