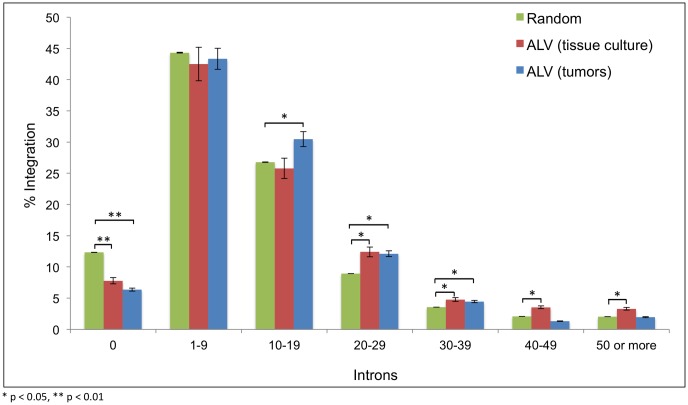
Fig 5. Distribution of ALV integrations relative to the level of splicing.
Correlation of ALV integrations in tissue culture and in tumors with the number of introns in the transcription units is depicted, using the ensembl Gallus gallus 4 genome. All the transcriptional units in the chicken genome are divided into 7 bins based on their number of introns, with the first bin depicting unspliced transcripts (with 0 introns). The X-axis shows the number of introns, and the Y-axis shows the percentage of integrations that occur near or within genes with the corresponding number of introns.

