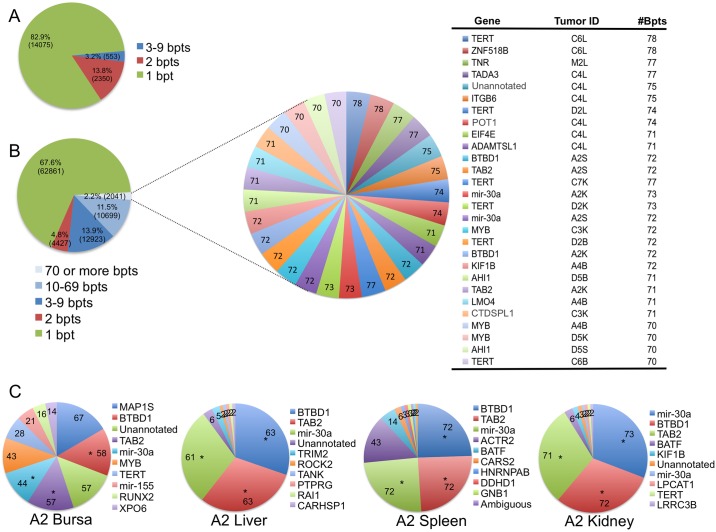
Fig 6. Distribution of integration sites in ALV-induced B-cell lymphomas and clonal expansion in metastases.
(A) The pie chart depicts a total of 16,978 breakpoints that were identified in tissue culture (CEFs, DT-40s and HeLa cells). The single breakpoints (82.9%) and the expanded breakpoints (17.1%) are highlighted as separate slices of the pie. (B) A total of 92,951 breakpoints were identified in 69 different ALV-induced neoplasms, from 41 different birds. Genes in proximity to integrations with 70 or more breakpoints are highlighted in a separate pie. Each slice represents a unique integration site, and the size of the slice represents the number of breakpoints for that site. The table shows integrations with the highest number of breakpoints along with the tumor in which that integration was identified. The tumor ID defines the bird number (A1, B1, C2, D2 etc.) along with the respective tissue of bursa (B), liver (L), kidney (K) or spleen (S) harboring the integration. (C) A sample set of individual primary (bursa) and secondary (liver, spleen and kidney) tumors from the same bird are illustrated. The top 10 most clonally abundant UISs are depicted within each pie chart, with the corresponding number of sonication breakpoints indicated on each slice. The list of the most proximal host genes is denoted next to the pie chart. UISs observed in multiple tumors of the same bird are denoted with an “*”. While, the primary tumor in the bursa exhibits heterogeneous distribution for clonally expanded UISs, the metastasized neoplasms exhibit a more homogenous distribution of expanded clones.

