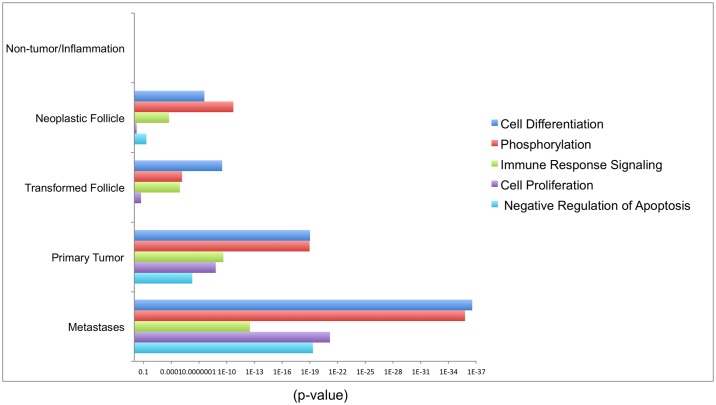
Fig 9. Functional classifications overrepresented among the clonally expanded integrations.
Five functional categories that are significantly overrepresented among the neoplastic follicles, primary tumors and metastases, are illustrated as a bar graph. The horizontal bars represent statistical significance as defined by −log (p-values). The integrations are analyzed by g:profiler software using a random list of integrations (n = 5000) as background. Since there are no overrepresented pathways involving the integration sites in inflammation or non-tumor samples, the bars are not visible. Due to use of varying sample size, all the analysis was adjusted for multiple testing with unequal sample size using the Mann Whitney U test.

