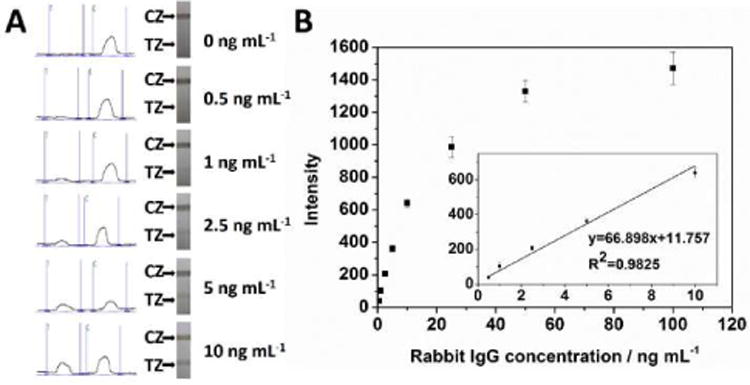
Fig. 4.

Typical optical responses and photo images of the LFSBs with an increasing rabbit IgG concentration (0.5 to 10 ng mL-1); (B) calibration curve of the LFSB. The inset shows the linear response for rabbit IgG. Each data point represents the average value obtained from three different measurements. Assay time: 20 min. CZ: control zone; TZ: test zone.
