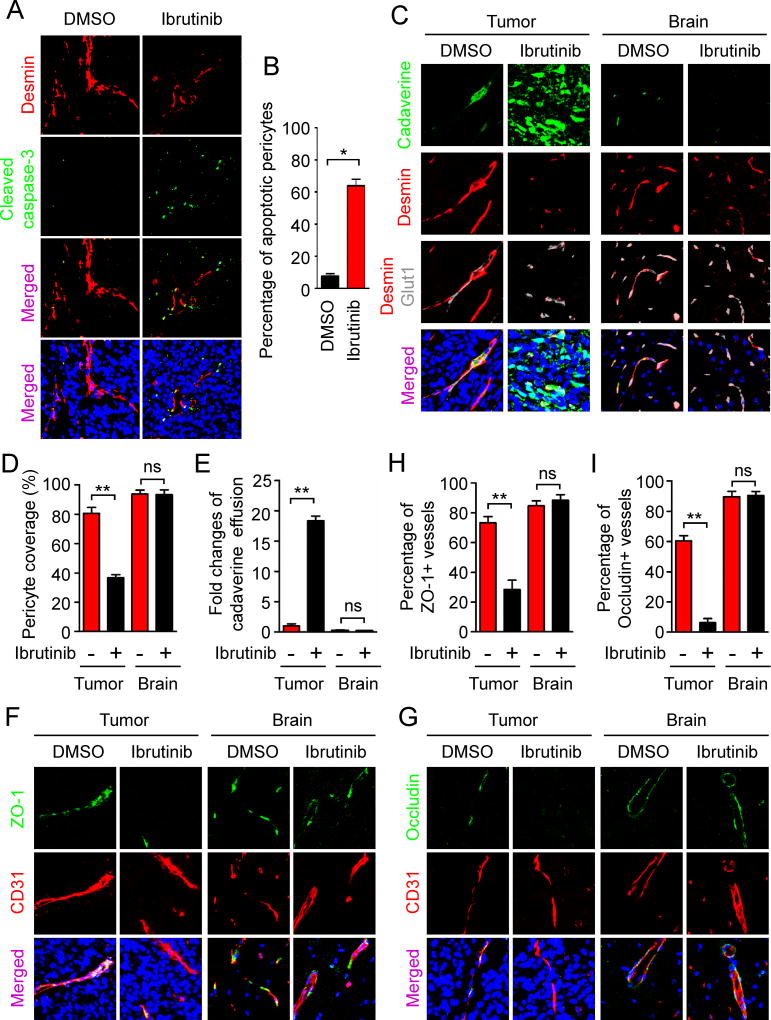
Figure 6. Inhibition of BMX by Ibrutinib Disrupted Neoplastic Pericytes and the BTB Tight Junctions to Increase Vascular Permeability in GBMs.
(A) Immunofluorescent staining of cleaved caspase-3 (green) and Desmin (red) in xenografts derived from T4121 GSCs after treatment with ibrutinib or DMSO for 3 days (scale bar, 80µm).
(B) Statistical quantification of (A) shows relative fraction of apoptotic pericytes in GBM xenografts after treatment with ibrutinib or DMSO. Percentage of apoptotic pericytes was defined by the numbers of pericytes (Desmin+) with cleaved caspase-3 positive staining normalized to the total numbers of pericytes (n = 5 tumors / group).
(C) Detection of vascular permeability with the autonomous fluorescent tracer cadaverine (green, 1kDa), and immunofluorescent staining of Desmin (red) and the endothelial marker Glut1 (gray) in xenografts derived from T4121 GSCs after ibrutinib or DMSO treatment for 5 days (scale bar, 40µm).
(D) Statistical analysis of the pericyte coverage in xenografts and the adjacent brain tissues from mice treated with ibrutinib or DMSO (n = 5 tumors / group).
(E) Statistical analysis of cadaverine effusion in xenografts and the adjacent brain tissues from mice treated with ibrutinib or DMSO (n = 5 tumors / group).
(F and G) Immunofluorescent staining of the tight junction markers ZO-1 (F) and Occludin (G) (green) and the endothelial marker CD31 (red) in GSC-derived GBMs and the adjacent brain tissues from mice treated with ibrutinib or DMSO control for 5 days (scale bar, 80µm).
(H and I) Statistical quantification to determine the ZO-1 (H) and Occludin (I) signals on vessels in xenografts and the adjacent brain tissues from mice treated with DMSO or ibrutinib (n = 5 tumors / group).
Data are presented as mean ± s.e.m. ** p < 0.01, * p < 0.05 and ns p > 0.05 as assayed by Mann Whitney test.
See also Figure S6.

