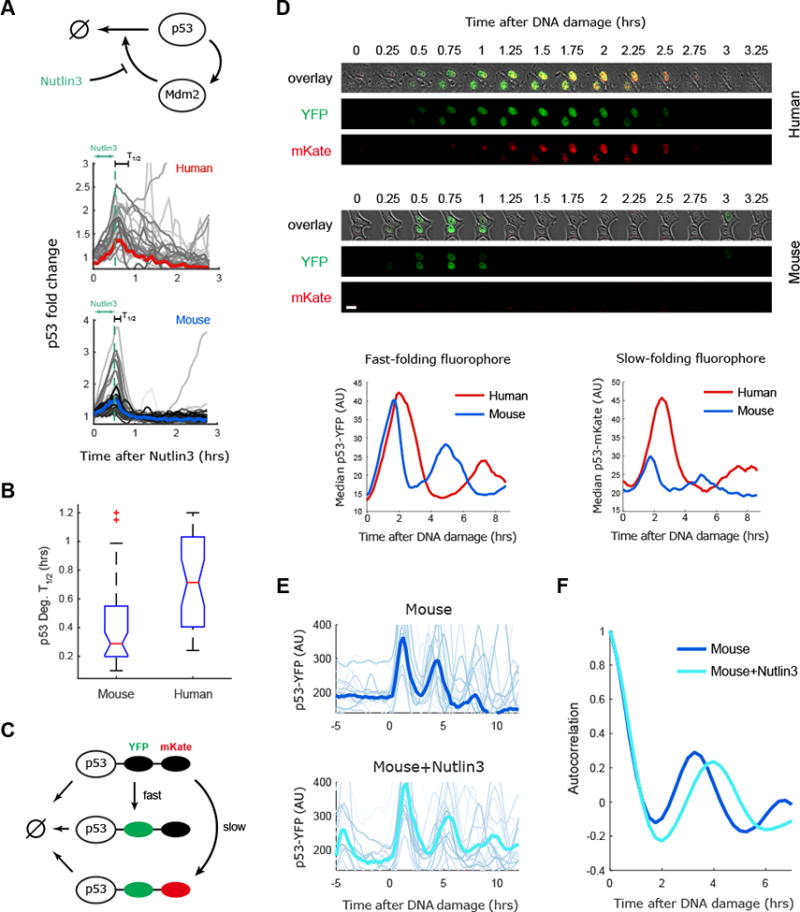
Figure 3. The degradation rate of p53 tunes the period of p53 oscillations between mouse and human cells.

(A) Mouse and human cells expressing the p53 reporter were treated with an inhibitor of p53 degradation (Nutlin3) for 30 minutes and p53 levels were quantified in single cells, the bold line gives the median of the trajectories. (B) Quantification of p53 degradation rate from the experiment shown in (A). The boxplots indicate the distribution of single cell degradation times, showing faster degradation of p53 in mouse than human cells (N>30). (C) A two color p53 reporter is used to quantify the half-life of p53 during the response to DNA damage (NCS). (D) Top: Images of mice and human cells expressing p53-YFP and p53-mKate in response to DNA damage. Bottom: Averaged dynamics of p53-YFP and p53-mKate2 in human and mouse cells responding to DNA damage (N>30). The amplitude of the fast folding fluorophore p53-YFP is comparable between human and mouse cell lines, but the levels of the slow folding fluorophore p53-mKate2 are higher in human cells, indicating a longer half-life of p53 in human cells. (E) Mouse cells (RAW264.3) expressing p53-YFP were treated with NCS with or without pre-treatment with the MDM2 inhibitor Nutlin3. NCS was applied at time 0. Bold lines represent the averaged behavior (N>30). (F) Autocorrelation of the data presented in (E) showing that reduced p53 degradation by Nutlin3 in mouse cells slows the p53-YFP oscillatory period.
