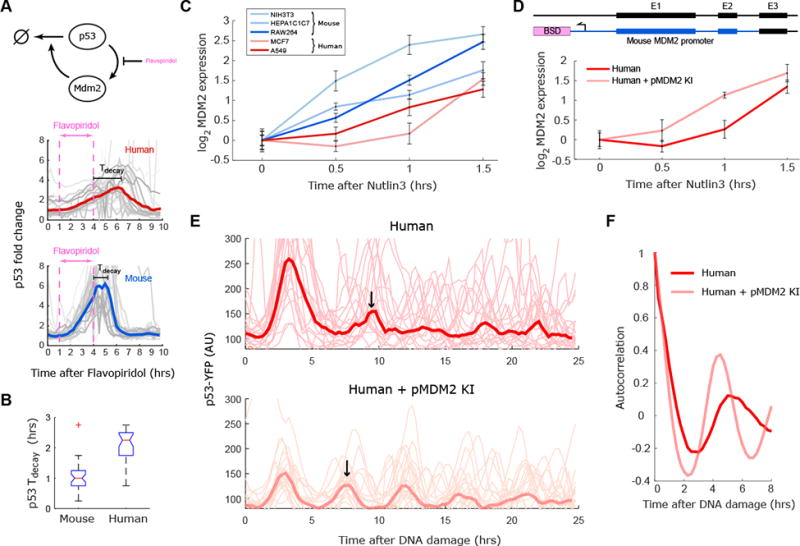
Figure 4. The transcription rate of MDM2 is faster in mice contributing to shorter period of p53 oscillations.

(A) Mouse and human cells with p53 reporters were treated with an inhibitor of transcription (Flavopiridol) for three hours and p53 levels were quantified. (B) Quantification of the delay between Flavopiridol washout and p53 degradation from the experiment shown in (A). The boxplots indicate the distribution of single cell delays (N>30). (C) Three mouse (red) and two human (blue) cell lines were treated with the MDM2 inhibitor Nutlin3, and MDM2 transcription was quantified using qPCR. The mouse lines show faster and stronger induction of Mdm2 transcript than the human lines. (D) Knock-in of MDM2 promoter (pMDM2KI) into the MDM2 locus in the human MCF7 cells results in rapid induction of MDM2 RNA quantified by qPCR after Nutlin3 treatment. (E) Single cell traces of p53-YFP in response to DNA damage (NCS) in parental human MCF7 cells and in cells knocked in with the mouse Mdm2 promoter (N>30). Bold lines represent the averaged behavior, with an arrow indicating the timing of the second pulse. (F) Autocorrelation of the data presented in (E) indicating that human cells knocked in with the mouse MDM2-promoter show more rapid oscillation than non-altered human cells. Error bars for C and D indicate SEM (N=3).
