
Figure 4. Impaired differentiation in 3-hit NSCs is associated with transcriptional downregulation of SOX2.
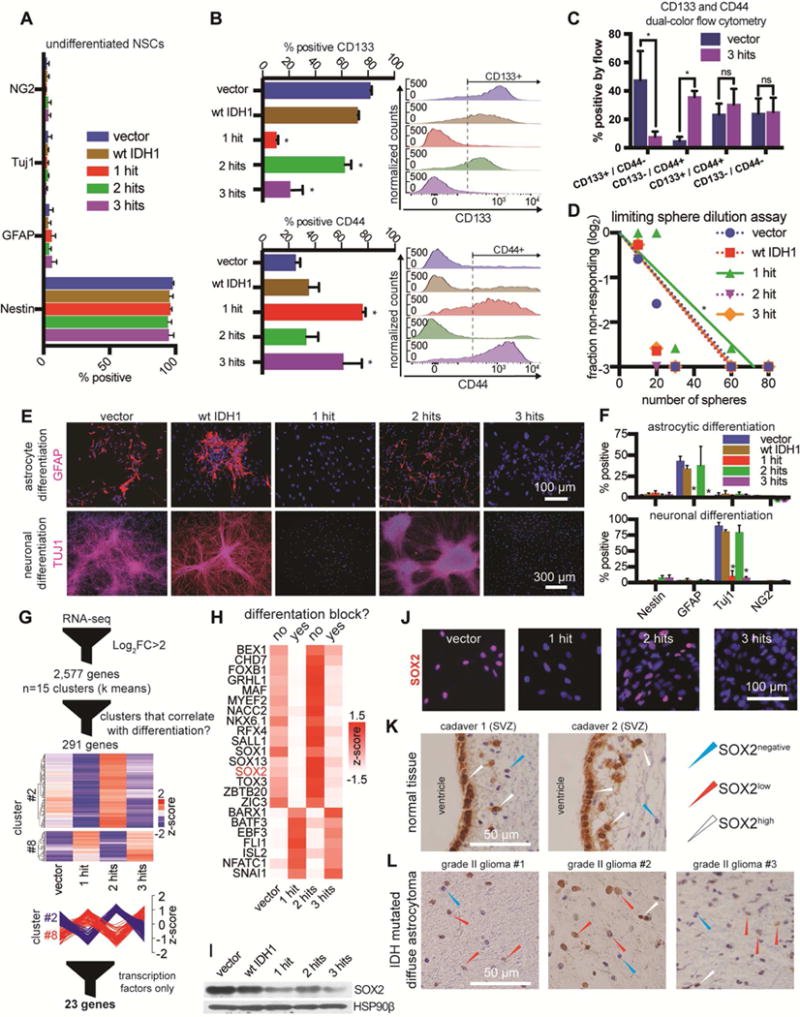
A. Immunofluorescence quantification of Nestin, GFAP, TUJ1 and Ng2 in NSCs cultured with EGF/FGF2.
B. Flow cytometric detection of CD133 (n=3/condition, ANOVA F(4,10)=53.09, p<0.0001). and CD44 (n=3/condition, ANOVA F(4,10)=6.83, p<0.001). *p<0.05, post hoc Tukey’s test.
C. CD133 and CD44 dual color flow cytometry (n=3/condition, multiple t-tests). *p<0.05; ns, not significant.
D. Sphere formation assay in limiting dilutions (n=3/condition, χ2 pairwise tests, p<0.001).
E. Representative immunofluorescence microscopic images of GFAP and TUJ1 in cultures that were differentiated to astrocytes (top) or neurons (bottom).
F. Quantification of immunofluorescence markers in astrocytic (top) or neuronal (bottom) differentiation conditions. Astrocyte differentiation: n=3/condition, ANOVA F(4,40)=10.75, p<0.0001; Neuronal differentiation: n=3/condition, ANOVA F(4,40)=86.68, p<0.0001. *p<0.05, post hoc Tukey’s test.
G. Vector, 1-hit, 2-hit and 3-hit NSCs were subjected to RNA-seq in duplicates. We found 2,577 differentially expressed genes (log2 fold-change>2 and qvalue<0.05). Genes were clustered into 15 k means groups and represented on a heatmap with no column clustering. Two of the 15 groups had genes with expression patterns that strongly correlated or anti-correlated with the ability of NSCs to differentiate (n=291 genes). Within these 2 groups we identified 23 transcription factors with IPA.
H. Transcription factors from (G) were visualized on a heatmap. The list includes SOX2, whose levels correlated with the ability of cells to differentiate.
I. Western blot of NSCs shows that SOX2 protein is downregulated most heavily in 1-hit and 3-hit NSCs, and to a lesser degree in 2-hit NSCs. HSP90β, loading control.
J. Immunofluorescence microscopy of NSCs stained for SOX2.
K. Cadaver tissue immunohistochemical staining of SOX2 reveals SOX2high ependymal cells and NSCs in the SVZ (n=2 adult patients).
L. LGA tumors (IDH mutated, P53 and ATRX loss, 1p/19q intact) showing diffuse brain infiltration contain predominantly SOX2low tumor cells (n=3 tumors).