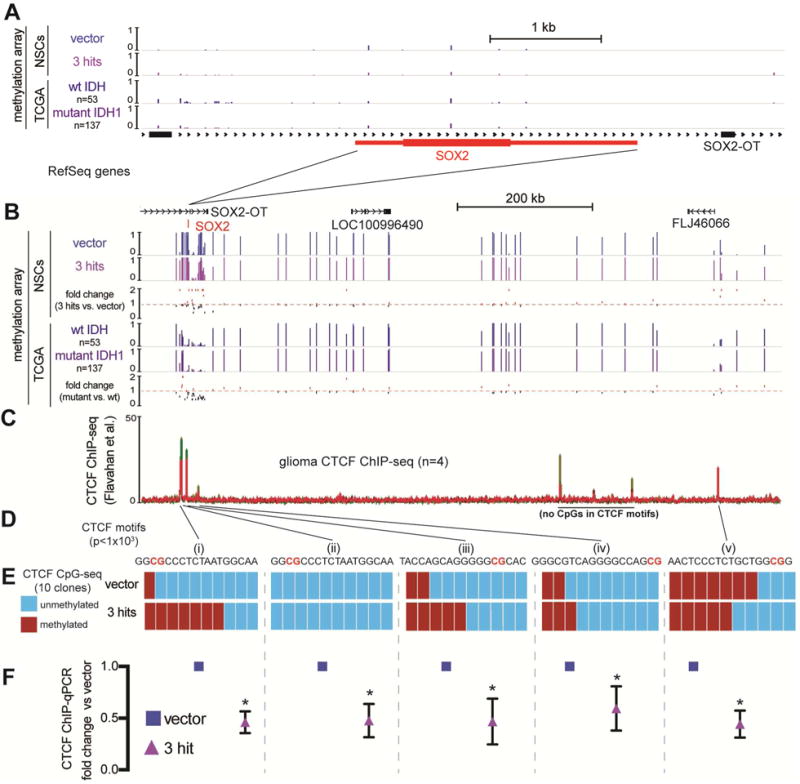
Figure 5. Mutant IDH1-mediated hypermethylation around the SOX2 locus leads to diminished CTCF occupancy.

A. The SOX2 locus (~6 kb window) aligned to 450k methylation array tracks of NSCs with the indicated transgenes (n=2) and averaged methylation beta values from TCGA grade II wild-type IDH gliomas (n=53) and mutant IDH, 1p/19q intact astrocytomas (n=157). The SOX2 locus has low levels of methylation in all these conditions. RefSeq genes are shown.
B. The region (~1 Mb) containing the SOX2 locus with tracks from (A). Shown below each pair of tracks is the calculated fold change in methylation beta value. Mutant IDH astrocytomas vs. wild-type IDH gliomas share a similar pattern of changes in methylation as the comparison of 3-hit NSCs vs. vector NSCs.
C. CTCF ChIP-seq tracks from grade III and IV gliomas (Flavahan et al., 2016). Red: mutant IDH grade III gliomas; Green: wild-type IDH grade IV gliomas.
D. CTCF motif analysis of each ChIP peak reveals high confidence CTCF motif locations with CpG sites highlighted in red (MEME suite motif scanning, p<0.001)
E. Targeted bisulfite sequencing of CpG sites within indicated CTCF motifs. Ten clones of vector and 3-hit NSCs were sequenced for every site. The most robust hypermethylation in 3-hit NSCs was observed in a CTCF site upstream of SOX2 (i).
F. CTCF ChIP-qPCR of each corresponding CTCF site. CTCF occupancy was reduced approximately ~2-fold in every site assayed (p<0.01, multiple t-tests).
