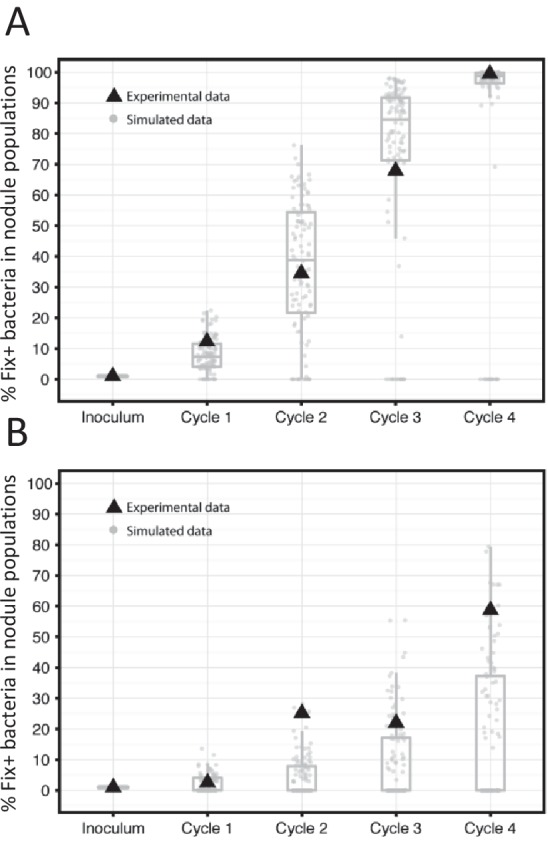
Figure 10. Frequency of Fix+ bacteria over 4 cycles of 35 (A) or 21 (B) days: simulations and experimental validation.

The proportion of Fix+ clones over four inoculation cycles was simulated and measured experimentally. Simulations and experiment were performed with an initial proportion of Fix+ clones of 1% and pools of 20 plants. Experiments were performed with an inoculum of 5 × 10³ Fix+/5 × 105 Fix- C. taiwanensis per plant. The results from 100 replicate simulations are shown as grey dots and boxplots (Figure 10—source data 1). Experimental data are shown as black triangles (Figure 10—source data 2).
