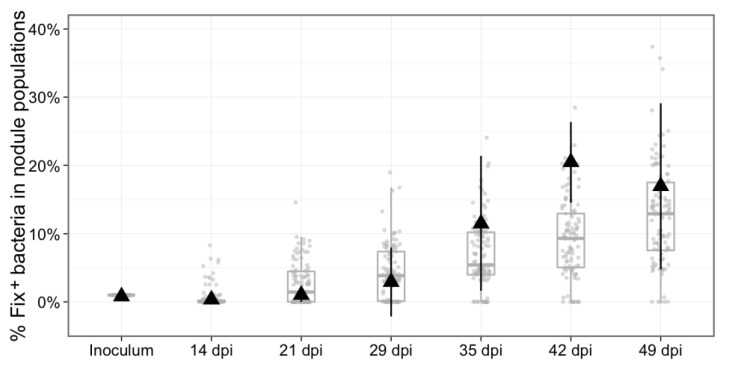
Figure 8. Experimental and theoretical reproductive fitness of Fix+ and Fix- bacteria following co- inoculation of M. pudica (ratio 1/100).
The proportion of Fix+ clones in nodules was experimentally measured and simulated over 49 days, following co-inoculation of 20 plants. Experimental data are shown as black triangles (Figure 8—source data 1). Black error bars represent standard deviation from 2 to 3 replicates. The results from 100 replicate simulations are shown as grey dots and boxplots (Figure 8—source data 2).

