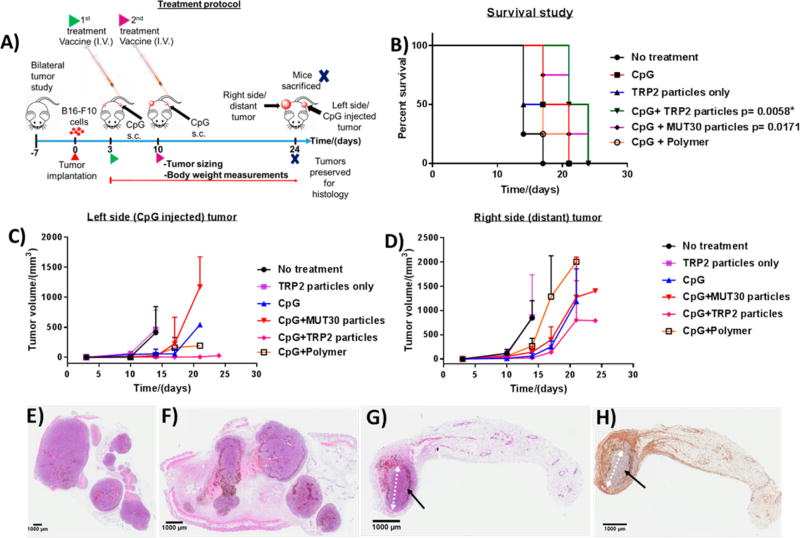
Figure 7.
Treatment protocol for in vivo studies with four animals per group (A). Kaplan–Meier survival plots (p ≤ 0.01 (Bonferroni corrected for five comparisons) was considered statistically significant with comparison to the no-treatment (NTC) group. TRP2 particles (p = 0.180), CpG (p = 0.031), CpG plus polymer particles (p = 0.042), CpG plus MUT30 particles (p = 0.0171) and CpG plus TRP2 particles (p = 0.0058) (asterisks indicate p < 0.01). For comparison against CpG, pCpG ≤ 0.05 considered to be statistically significant, CpG plus TRP2 particles versus CpG (pCpG = 0.0598) ) (B). Tumor sizes of the left side (CpG-injected tumor) (C) and right side (distant) tumor (D). Histology results showing hematoxylin and eosin (H&E)-stained tumor tissue from a mouse in the no-treatment group (E), CpG plus MUT30 nanoparticle-treated group (F), and H&E- (G) and F4/80- (macrophage marker) stained fat pads from a mouse in the CpG plus TRP2-nanoparticle-treated group (H); the black arrows show a rim of dead and dying cells surrounding a small central mass of viable tumor cells after treatment (ellipse-like shape, with the white arrow showing the major axis). Raw tumor sizes and body weights are available in Figures S12 and S13.

