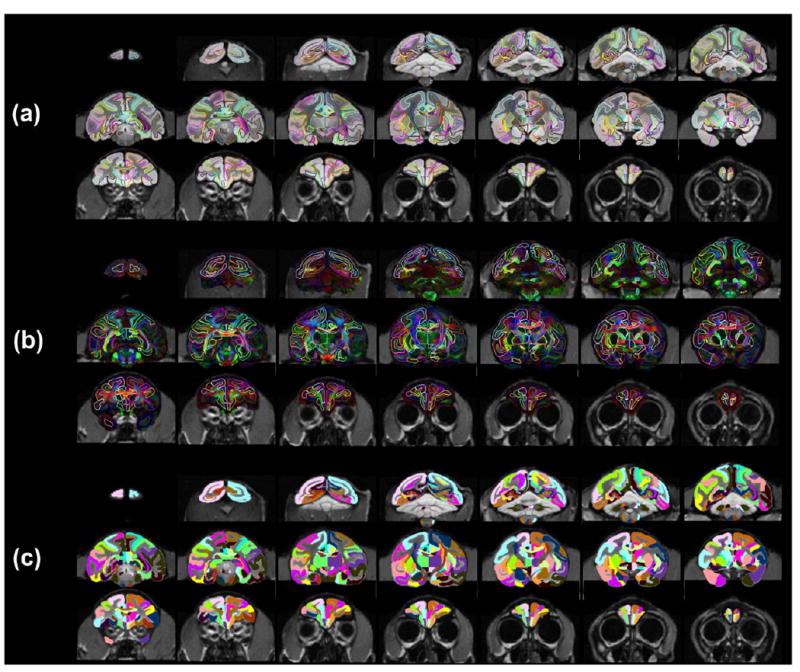
Figure 7.

All atlas labels on the population-averaged aDWIs (a), population-averaged orientation-encoded colormaps (b) and single-subject T1 weighted image (c) in the evenly sampled coronal planes from anterior to posterior brain. Population-averaged aDWIs and orientation-encoded colormaps were integrated into in vivo space with bony and facial landmarks kept from in vivo T1 weighted images
