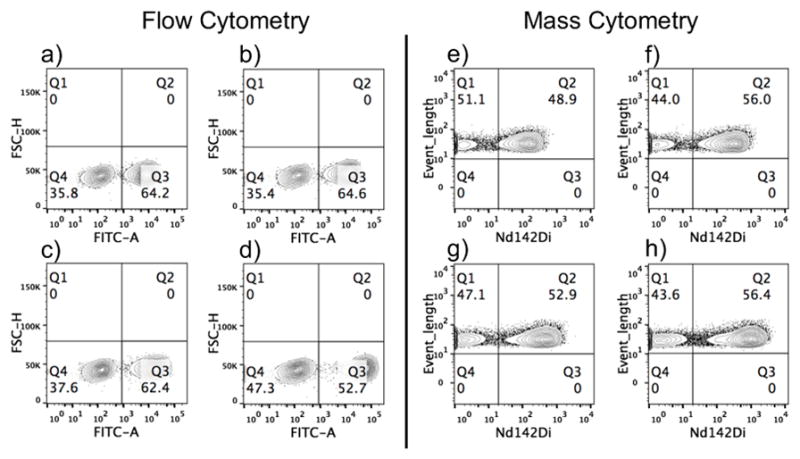
Figure 3.

Titration of MCF-7/T cell mixtures using Pdots-PC-Nd-SA with flow cytometry (a–d) and mass cytometry (e–g). a) and e): 1 ppm; b) and f): 2 ppm; c) and g): 5 ppm; d) and h): 10 ppm. In (a–d), Q4 represents T cells and Q3 represents MCF-7 cells; in (e–h), Q1 represents T cells and Q2 represents MCF-7 cells.
