Figure 6.
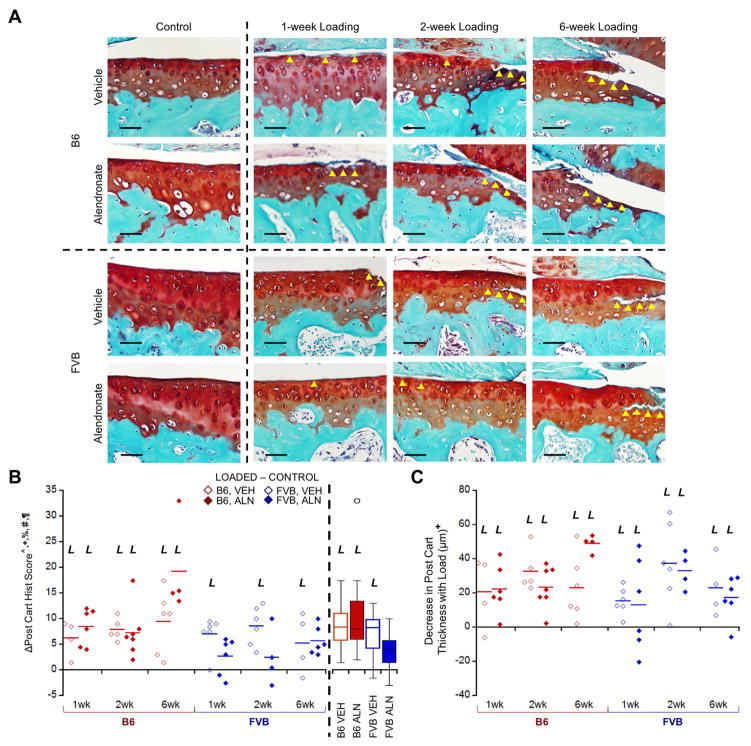
Loading damaged posterior cartilage matrix in B6 and FVB mice treated with VEH and ALN after 1, 2, and 6 weeks. Δ = [Loaded – Control] (left – right limb) data shown. (A) In most groups, loading created cartilage damage that increased over time as was reflected in the histological scores. (B) FVB mice treated with ALN did not exhibit cartilage damage with loading (pooled group means summarized in box plot). (C) Loading also decreased posterior cartilage thickness over time. Scale bar = 50μm. p<0.05 for ^strain, +duration, §treatment, %strain*duration, #strain*treatment, ¶duration*treatment. L indicates load effect (p<0.05). Yellow arrowheads indicate areas of cartilage damage.

