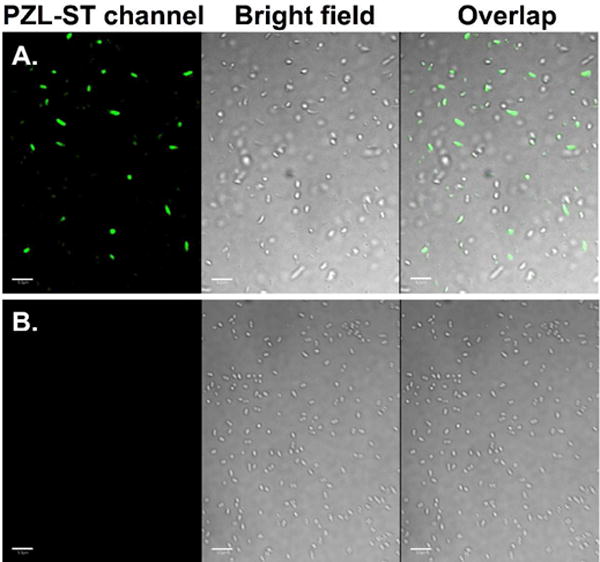
Figure 4. Selective labeling of E. coli cells expressing HdeA-F28KStyr.

(A) HdeA-F28KStyr mutant that was expressed in the presence of KStyr; (B) Wild-type HdeA that was expressed in the presence of KStyr. For all images, the left panel shows fluorescent images of E. coli cells in the PZL-ST channel (405 nm excitation and 510 nm emission), the middle panel shows bright-field images of the same E. coli cells, and the right panel shows composite images of bright-field and fluorescent images. Scale bars, 10 μm.
