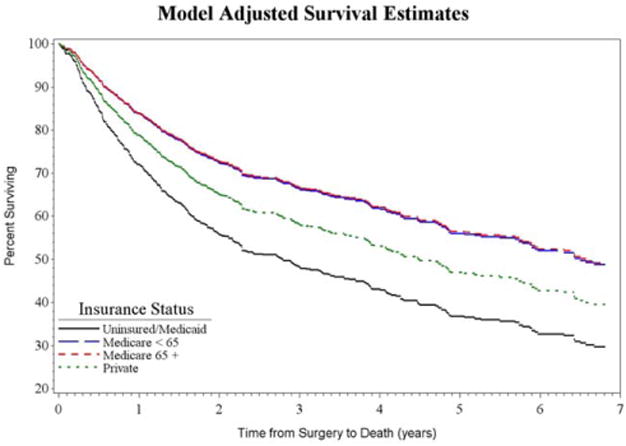
Fig. 2.

Kaplan-Meier survival curve by insurance status, adjusted for age, gender, race, tobacco and alcohol history, prior radiation, American Society of Anesthesiologists score, tumor and nodal stage, reconstruction type, and postoperative complications. Survival differences between insurance status groups are significant (P = 0.0015). [Color figure can be viewed in the online issue, which is available at www.laryngoscope.com.]
