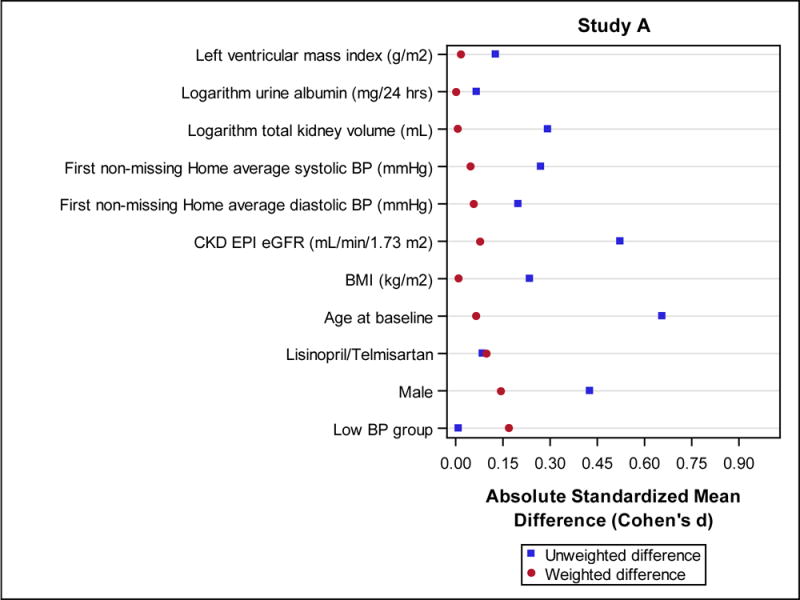
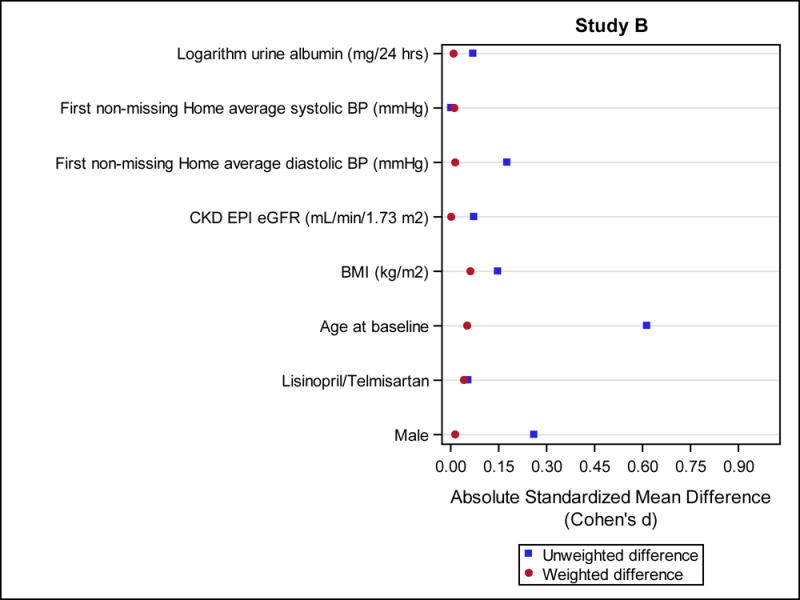
Figure 1.


Standardized mean differences with (weighted differences) and without (unweighted differences) accounting for the inverse probability of treatment weight (IPTW). Baseline characteristics which were used in the propensity score models are shown for Study A (Fig. 1 a) and Study B (Fig. 1 b).
