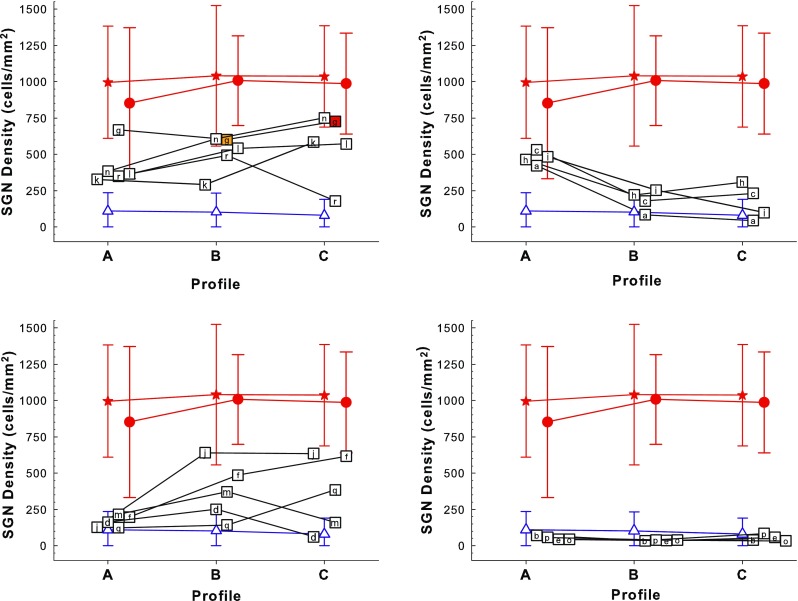
FIG. 4.

Density of SGN cell bodies in Rosenthal’s canal in the first three half-turns (profiles A, B, and C) of the cochlea. Symbols are jittered along the x axis to avoid overlap. To make a clearer presentation, the data are divided among four panels based on post hoc qualitative assessment of the patterns across profiles, as detailed in Table 2. Each symbol containing a letter (“a” through “r”) represents an individual animal from the experimental group, which received neomycin followed by AAV.Ntf3 and a cochlear implant. Note that animal “g” had remaining hair cells in profiles B (40 %) and C (100 %) as indicated by the orange and red fill in the symbols. Animal “a” had some remaining hair cells apical to profile D. Animal “p” had measurable behavioral responses to acoustic stimulation at 250 Hz to 2 kHz, but no IHCs were found on histological analysis. For reference, each panel also shows the means plus and minus two standard deviations of SGN densities for the comparison and control groups: Red filled stars are for the normal animals, red filled circles are for the implanted-hearing group, and blue triangles are for the 14 deafened-controls. Figure 3 gives the details for these three groups.
