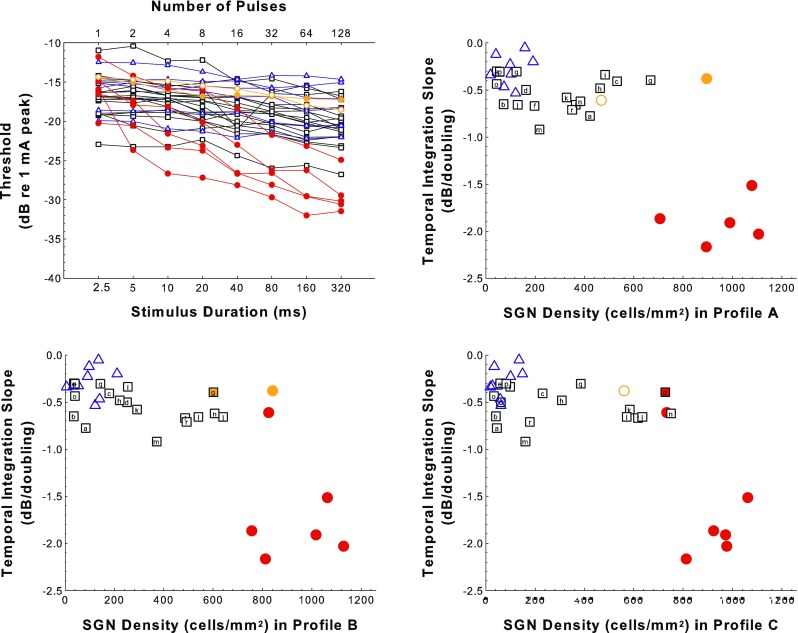
FIG. 6.

Temporal integration (TI) results. Examples of TI functions (psychophysical detection threshold vs. pulse-train duration for 400 pps pulse trains) for animals from the various treatment groups are shown in the top-left panel. Slopes of the TI functions are plotted as a function of SGN density for profiles A, B, and C for experimental, control, and comparison animals in the top-right panel (SGN-A) and the two bottom panels (SGN-B and SGN-C). Symbols and colors follow the same rules as described in the caption of Figure 5. However, note that for the deafened-control and implanted-hearing comparison groups TI functions were measured for fewer animals than were used for the MPI data shown in Figure 5.
