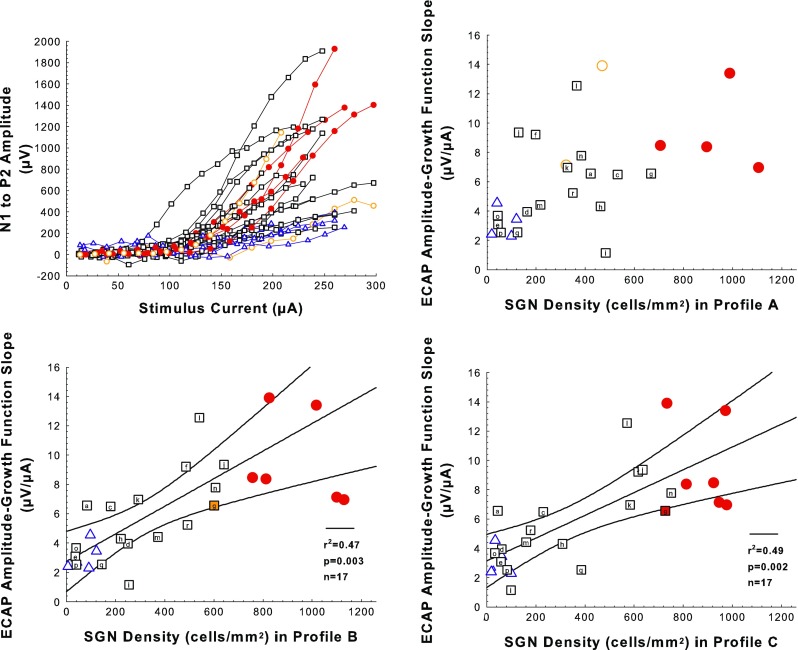
FIG. 7.

Electrically evoked compound action potential (ECAP) amplitude growth function (AGF) results. Examples of ECAP AGFs (ECAP level versus stimulus level) are shown in the top-left panel. Slopes of the ECAP AGFs plotted as a function of SGN density for profiles A, B, and C for experimental, control, and comparison animals are shown in the top-right panel (SGN-A) and the two bottom panels (SGN-B and SGN-C). Symbols and colors follow the same rules as described for Figure 5 but the number of comparison cases for which ECAP data were obtained is smaller. Slopes for individual cases represent mean slopes of multiple growth functions obtained during a period when slopes were relatively stable over time (day 150 post-implantation to sacrifice). The number of slopes per animal averaged 8.0 and the standard deviations averaged 1.1 μV/μA. The black regression lines and corresponding statistics show the statistical relationship between ECAP AGF slopes and SGN density for the AAV.Ntf3 group; black curving lines are 95 % confidence ranges.
