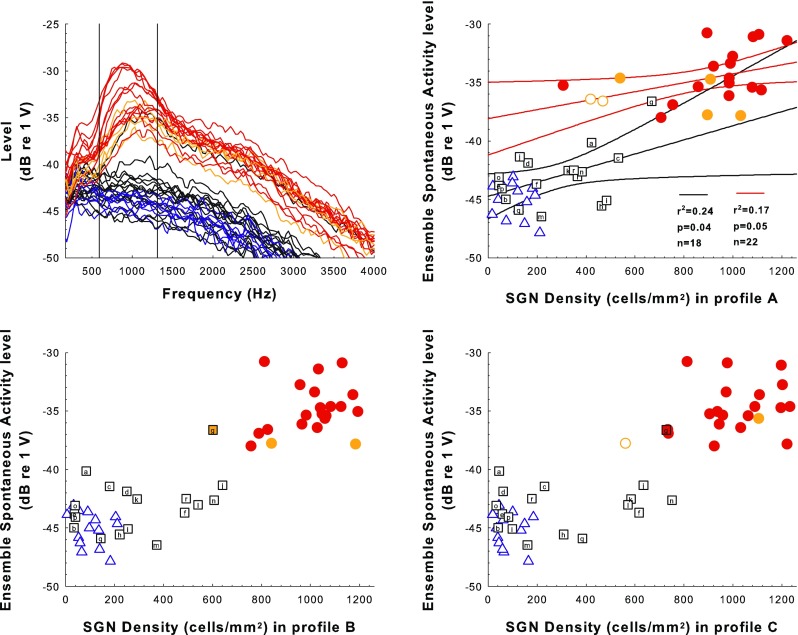
FIG. 9.

Ensemble spontaneous activity (ESA) results. Examples of ESA spectra for animals from the various treatment groups obtained within a few days of sacrifice are shown in the top left panel. ESA levels averaged over the range between 593.75 to 1312.5 Hz that are plotted as a function of SGN density for profiles A, B, and C for experimental, control, and comparison animals are shown in the top-right (SGN-A) and the two bottom panels (SGN-B and SGN-C). Symbols and colors follow the same rules as described for Figure 5. Note that the black ESA spectrum trace in the upper-left panel that is similar to the orange traces is from animal “g” where there were no hair cells found in profile A but hair cells were present in profile B and more apical profiles. In the top-right panel, the black and red regression lines and corresponding statistics show the relationship between ESA levels and SGN density for the AAV.Ntf3 (black traces) and implanted-hearing group (red traces), respectively; curving lines are 95 % confidence ranges.
