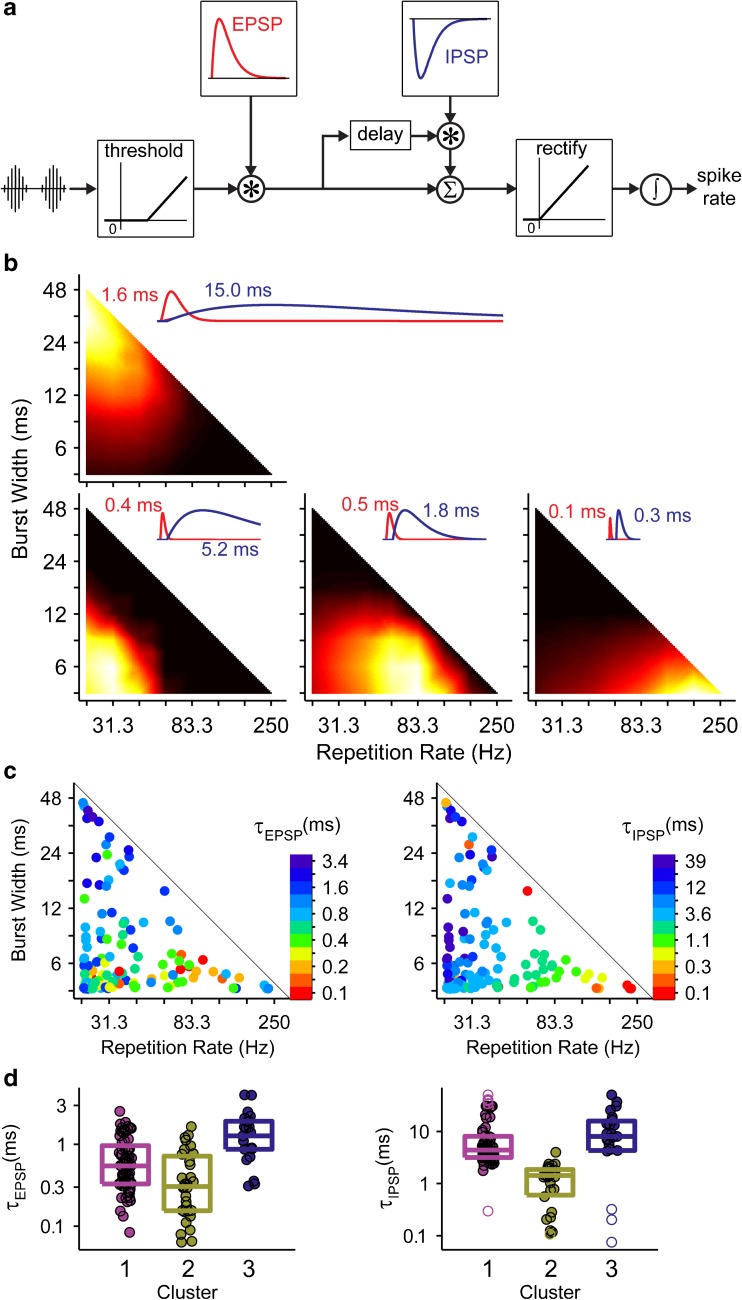
FIG. 10.
Smith and Delgutte (2008) model of envelope coding can reproduce diverse sensitivities to envelope shape. a Block diagram of model. See text for details. Asterisk convolution. sigma waveform sum. integral sum over time. b Best fit of model to four representative data sets. Data were divided into four clusters (instead of three as in Fig. 4), and the model was fit to the mean heat map in each cluster. Insets show EPSPs and IPSPs of each fit labeled with the corresponding time constant. c Model was also fit to the heat maps of every single unit. Dots are plotted at the optimal width/rate combination for each neuron. The excitatory (left) and inhibitory (right) time constants of each best fit are indicated using a log color scale. d Box plots show distributions of best-fit excitatory and inhibitory parameters for the neurons clustered as in Fig. 4. Rectangle indicates interquartile range. Center line indicates median value. Unfilled symbols indicate outliers.

