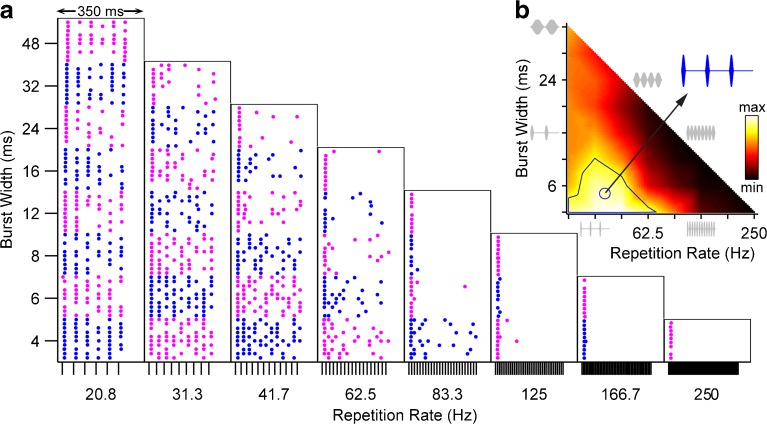
FIG. 2.
Responses of one IC neuron as a function of envelope burst width and modulation rate. a Dot rasters show spike times relative to stimulus onset. Alternating colors distinguish blocks of trials at different burst widths. Ticks at bottom of each column mark the start of each modulation cycle. b Corresponding heat map showing normalized firing rate as a function of envelope shape. Solid line: contour enclosing firing rates ≥75 % of maximum. Circle: centroid of 75 % contour. Blue inset: best envelope shape (waveform corresponding to centroid). Gray: waveforms illustrating subset of envelope shapes on perimeter of heat map.

