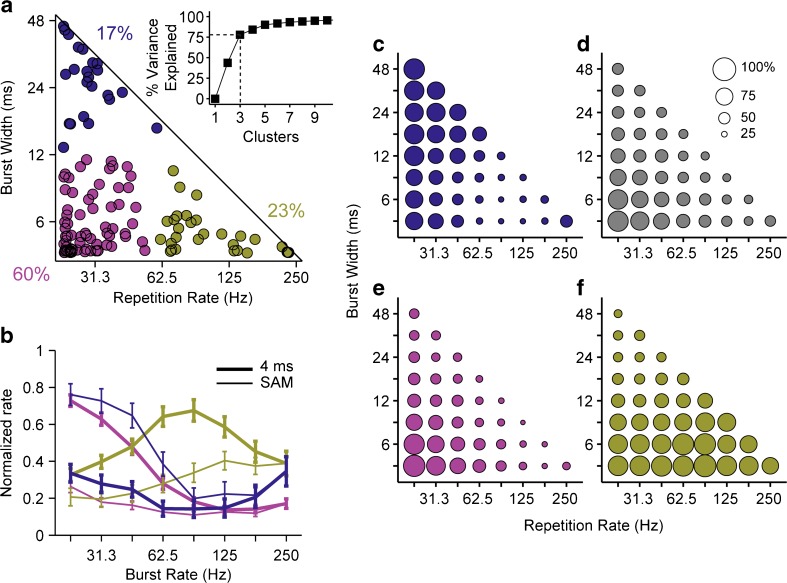
FIG. 4.
Sensitivity to envelope shape varies widely across IC neurons, but a majority prefers the shortest bursts and lowest modulation rates. a Scatterplot of centroids of 75 % contours from firing rate heat maps (N = 121 neurons). Colors segregate the centroids into three (k-means) clusters, which account for ~80 % of the variance (bottom). The majority of the neurons fall in the cluster preferring bursts <12 ms and rates <62.5 Hz (red). b Comparison of normalized rate modulation transfer functions across clusters shown in a, and between pure SAM (thin lines) and 4-ms bursts (thick lines). Rate is normalized for each neuron by its maximum firing rate across the entire parameter space. Curves show mean ± std. err for neurons in each cluster. c–f: Bubble plots show fraction of neurons that fire >1 spike/stimulus to each envelope shape. Colored bubbles correspond to clusters in a. Gray bubbles show data pooled across all neurons.

