FIG. 5.
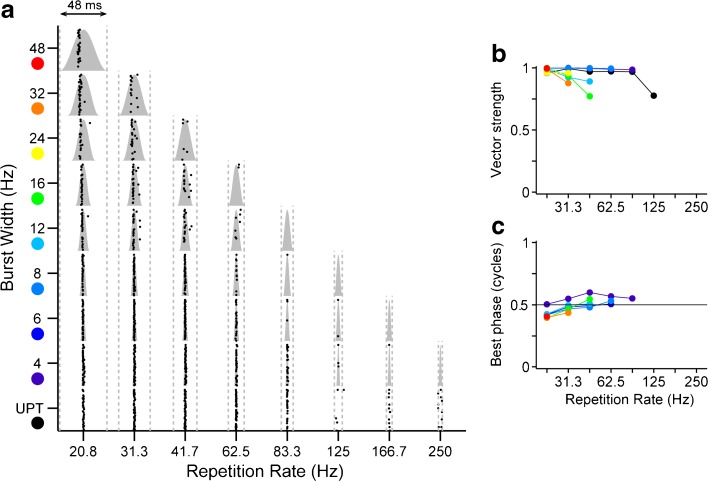
Response of one IC neuron demonstrates precise phase locking near the peak of the stimulus envelope. Same neuron as in Fig. 2. a Period dot rasters show spike times relative to modulation period. Times are shifted to position the peak of the burst in the center of the period and first spike latency is removed. Gray shading, envelope burst shape. Gray dotted lines, modulation period. b Vector strength vs. modulation rate. c Response phase relative to burst width vs. modulation rate. b, c: Colors indicate different burst widths (as shown in a). UPT low-rate unmodulated pulse train.

