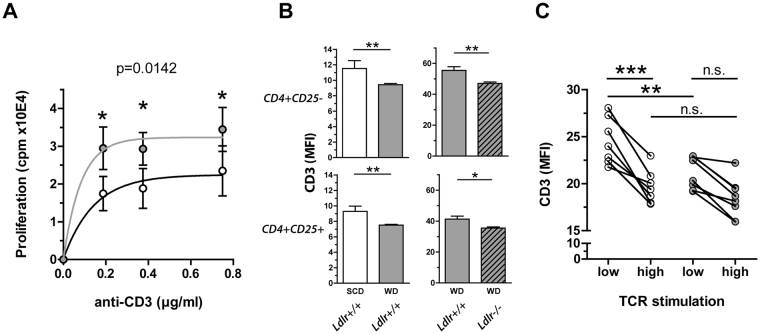
Figure 4.
Enhanced proliferation and TCR internalization of CD4+ T cells in hypercholesterolemia. (A) Proliferation of splenocytes derived from 4 weeks cholesterol-free standard chow diet (SCD, white) or 0.15% cholesterol-containing Western diet (WD, gray) fed mice stimulated with different anti-CD3 concentrations; pooled data from three independent experiments with four technical replicates for each data point are shown (n = 9). Values are expressed as mean ± SEM; two-way ANOVA with Bonferroni’s multiple comparison post hoc test was performed for statistical analysis; displayed p-value indicates the significant effect of the diet on T cell proliferation. (The p-value for the effect of the antibody dilution is not shown). (B) CD3 internalization in splenic CD4+ CD25− (upper panel) or CD4+ CD25+ (lower panel) T cells derived from wild type mice (Ldlr+/+) fed SCD (white) or WD (gray) for 4 weeks, assessed by anti-CD3 surface stainings utilizing Pacific Blue-conjugated antibody (n = 8) (left panel) or derived from Ldlr+/+ (plain) and LDL receptor knockout (Ldlr−/−) mice (hatched) fed WD for 4 weeks, assessed by anti-CD3 surface stainings utilizing phycoerythrin-conjugated antibody (n = 6) (right panel). Values are expressed as mean ± SEM; two-tailed Mann Whitney U test was performed for statistical analysis. (C) CD3 surface expression levels of naïve CD4+ T cells derived from 4 weeks SCD (white) or WD (gray) fed wild type mice following 24 h TCR stimulation with 0.5 μg/ml (low) and 1.5 μg/ml (high) soluble anti-CD3 antibody, assessed by anti-CD3 surface stainings utilizing peridinin chlorophyll-conjugated antibody. Pooled data from 2 independent experiments are shown. Repeated measures ANOVA with Bonferroni’s post-hoc test was performed for statistical analysis; *p < 0.05, **p < 0.01, ***p < 0.001.

