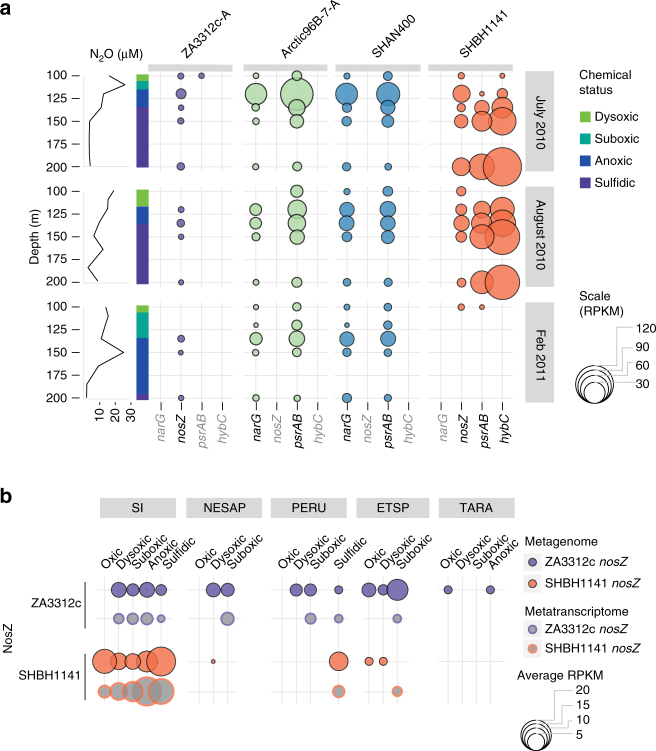
Fig. 4.
Expression of selected Marinimicrobia energy metabolism genes. a Expression of selected genes involved in Marinimicrobia energy metabolism in Saanich Inlet station SI03 at three time points and five depths between 100 and 200 m. Size of circle represents reads per kilobase per million mapped (RPKM)52 for metatranscriptomic reads mapped to the selected genes for the indicated population genomes. Water column redox state for each time point encoded on left axis and nitrous oxide concentration profile for each time point on left. Enzymes: nitrate reductase (narG), Nitrous oxide reductase (nosZ), polysulfide reductase subunits A and B (psrAB) and Ni-Fe hydrogenase subunits A and B (hybC). b Detected genes and transcripts for Marinimicrobia ZA3312c and SHBH1141 nosZ along eco-thermodynamic gradients from oxic (>90 µmol O2), dysoxic (20–90 µmol O2), suboxic (1–20 µmol O2), anoxic (<2 µmol O2), and sulfidic conditions in Saanich Inlet (SI) time series, Northeastern Subarctic Pacific (NESAP), Peru, Eastern Tropical South Pacific (ETSP), and TARA Oceans (no transcriptomes available) data sets. For SI and ETSP dot size represents average reads per killobase per million mapped (RPKM) summed for a given nosZ type for each metagenome or metatranscriptome and averaged by the total number of metagenomes or metatranscriptomes for a given water column classification. For ETSP, Peru, and TARA bubble size is the number of reads (ETSP and Peru) or contigs (TARA) with nosZ averaged per number of metagenome or metatranscriptomes for a given water column classification

