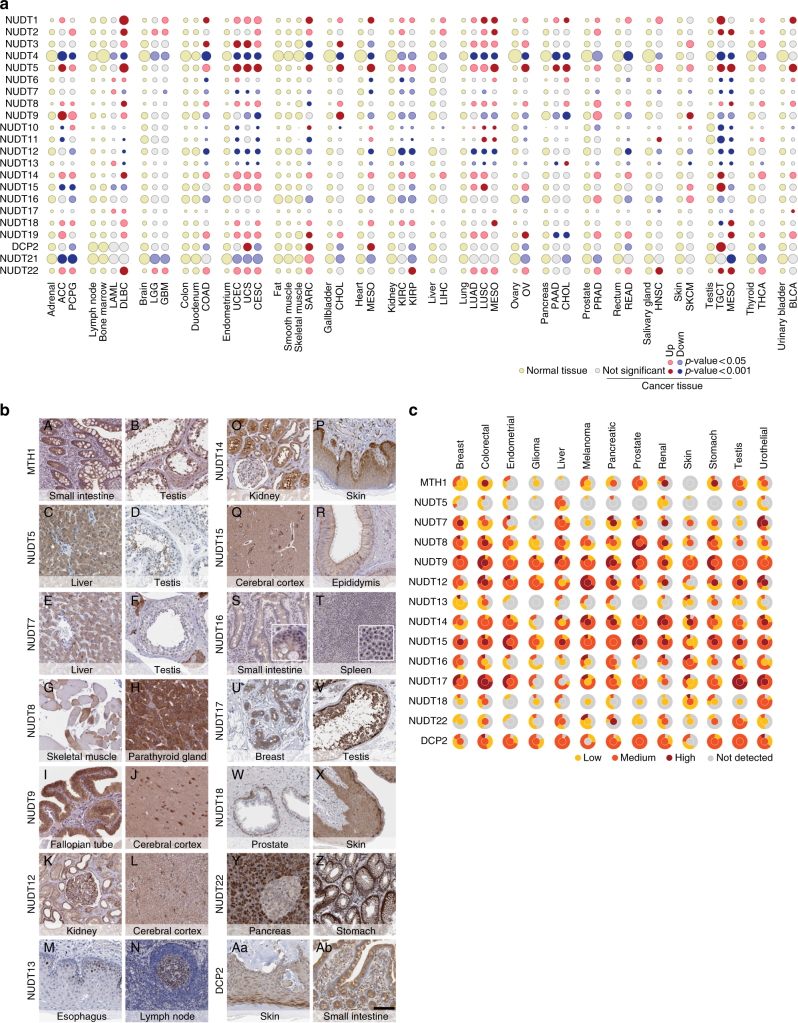
Fig. 3.
mRNA and protein expression across normal and cancer tissues of the human NUDIX hydrolases. a mRNA expression in cancer tissues from the TCGA compared with the non-cancer counterparts from the HPA. Red and blue indicate up- or downregulation, and light brown and gray indicate normal tissue of origin or non-significance in cancer tissue, respectively. A complete list of the cancer types acronyms can be found in the Supplementary Table 3. b Immunohistochemical stainings of normal tissues. a, b MTH1 shows cytoplasmic staining of glandular cells in small intestine and cytoplasmic/nuclear staining seminiferous ducts and testicular Leydig cells. c, d NUDT5 shows cytoplasmic staining hepatocytes and sperms in testis. e, f NUDT7 shows cytoplasmic staining of hepatocytes and testicular Leydig cells. g, h NUDT8 shows patchy cytoplasmic staining of skeletal muscle and parathyroid glandular cells. i, j NUDT9 shows cytoplasmic staining of glandular cells in the fallopian tube and staining of neurons and neuropil in cortex. k, l NUDT12 shows cytoplasmic/membranous staining of tubules and glomeruli in kidney and staining of glial cells in cortex. m, n NUDT13 shows nuclear staining in a subset of squamous epithelial cells in esophagus and in germinal center cells of the lymph node. o, p NUDT14 shows cytoplasmic and nuclear staining of tubules and glomeruli in kidney and cytoplasmic staining of epidermis (enriched in the basal layer). q, r NUDT15 shows cytoplasmic/membranous staining of neurons and neuropil in cortex and cytoplasmic/membranous staining of glandular cells in epididymis. s, t NUDT16 shows nucleolar staining of glandular cells in small intestine and white pulp cells in spleen. u, v NUDT17 shows cytoplasmic/membranous staining of glandular breast cells and of seminiferous ducts in testis. w, x NUDT18 shows cytoplasmic and nuclear staining of basal cells of the prostate and in epidermis. y, z NUDT22 shows cytoplasmic staining of exocrine (strong) and endocrine (weak) pancreatic cells, and cytoplasmic/membranous staining of glandular cells of the stomach. Aa, Ab DCP2 shows cytoplasmic staining in epidermis, and in stromal and glandular cells of the small intestine. c Qualitative assessment graphical representation of the human NUDIX protein expression. The inner circles represent the expression in the normal tissue corresponding to its cancer counterpart. The outer circle represents the percentage of cancers that displayed either not detectable, low, medium, or high protein expression

