Fig. 5.
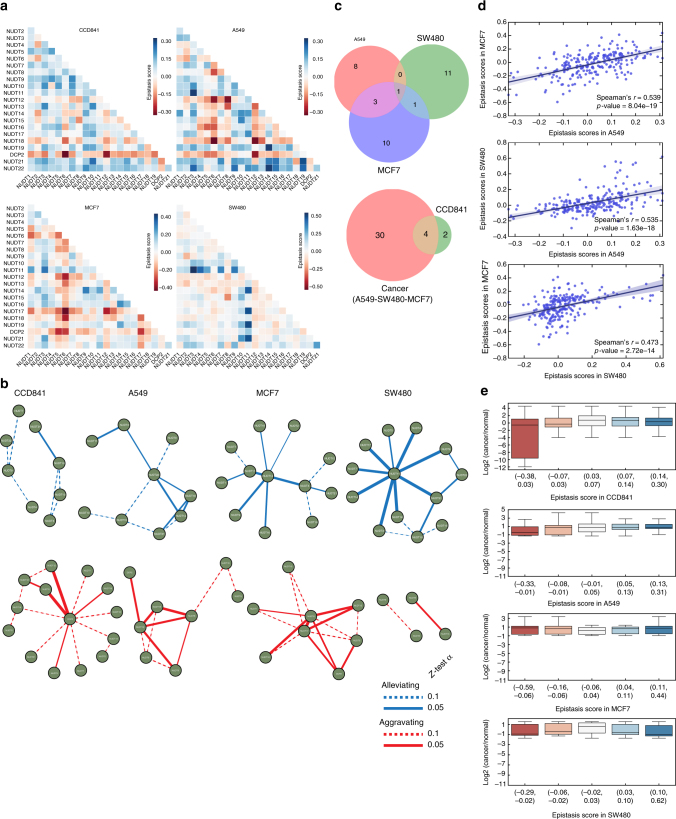
Survival genetic interactions between NUDIX genes. a Genetic interactions between NUDIX genes in the four cell lines, CCD841, and cancer cell lines A549, MCF7, and SW480. A genetic interaction was assigned to pairs of genes based on deviation of cell viability of the double knockdown from cell viability of the double knockdown that would be expected if the genes were not interacting. The expected viability was determined with a multiplicative null function. The interaction maps include negative (or aggravating) interactions, as well as positive (or alleviating interactions). Alleviating interactions, shown in blue, suggest that certain NUDIX product operate in concert or in series within the same pathway. b Statistically significant genetic interactions between NUDIX genes in the four cell lines, CCD841, and cancer cell lines A549, MCF7, and SW480 are visualized using networks. For each gene pair, the genetic interaction was assessed by using a two-tailed Z-test α = 0.1 (dotted line and solid line) or α = 0.05 (solid line only). Shown are genetic interactions whose values are significantly larger (indicating alleviating interaction) or significantly smaller (indicating aggravating interaction) than values in the 90% (dotted line and solid line), or 95% (solid line only) of interaction density in the respective cell line. c The overlap of significant genetic interactions from b (α = 0.05) is shown using Venn diagrams. The size of each circle in the diagram is proportional to the number of significant genetic interactions in the respective cell line. d Scatter plot indicating the correlation between each epistasis scores corresponding to each cell line, Spearman’s correlation indicates high similarity. e Box plots comparing log2 mRNA expression in cancer vs normal tissues, and epistasis score. Five epistasis score bins were used to classify the NUDIX genetic interactions. The list of each NUDIX interaction can be found in Supplementary Data 1

