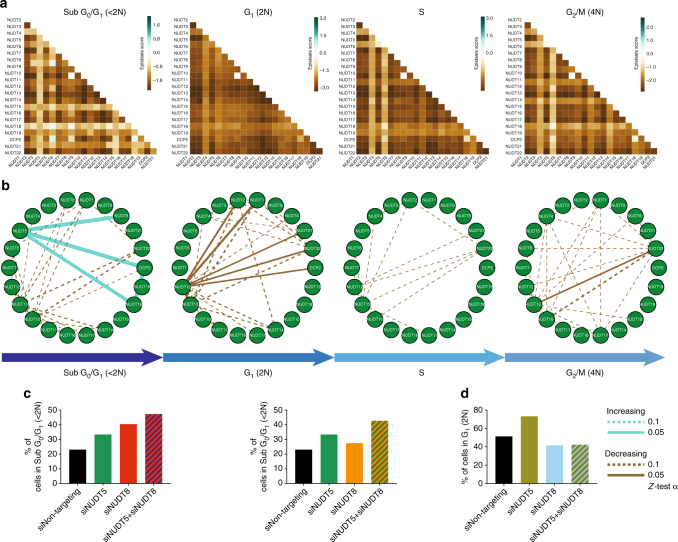
Fig. 6.
Cell cycle genetic interactions between NUDIX genes. a Cell cycle-based interactions between NUDIX genes in the A549 cell line. The interaction maps visualize interactions determined based on the fraction of pairwise siRNA-depleted cells in each cell cycle phase. Shown is one interaction map per cell cycle phase. In each map, an interaction score was assigned to a pair of genes based on the difference between the observed cell fraction of the double knockdown and the expected cell fraction of the double knockdown. The expected cell fraction was determined using a multiplicative null model estimating the cell fraction of a double knockdown that would be expected if the genes were not interacting. The interaction maps include negative (or aggravating) interactions in brown, as well as positive (or alleviating) interactions in green. Alleviating interactions suggest that certain NUDIX product operate in concert or in series within the same pathway. b Statistically significant cell-cycle-based interactions between NUDIX genes in the A549 cell line are visualized using circular networks. The panel shows one network for each cell cycle phase. For each gene pair, the interaction was assessed by using a two-tailed Z-test (α = 0.1). Edges in each network represent interactions whose values are significantly larger (indicating alleviating interaction) in cyan or significantly smaller (indicating aggravating interaction) in brown, than values in the 90% of interaction probability density. The interactions were selected independently and separately for each cell cycle phase in the A549 cell line. The width of network edges stands for statistical significance. c Bar charts indicating the increase in % of cells in SubG0/G1 (<2 N) phase when NUDT5 and NUDT8, as well as NUDT5 and DCP2 are co-depleted. d Bar chart indicating the decrease in % of cells in G1 (2 N) phase when NUDT1 and NUDT12 are co-depleted. The % of cells in each cell cycle phase were obtained by measuring the integrated intensity of the DNA counterstained with Hoechst, the signal was then processed using PopulationProfiler, as previously described46

