Fig. 8.
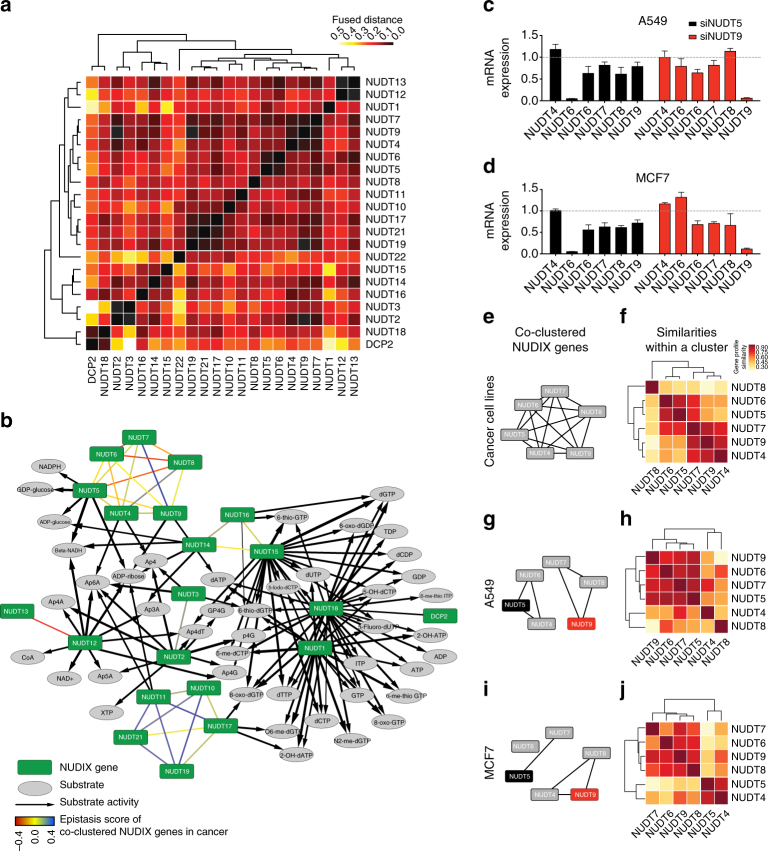
Clustering of the human NUDIX family. Integrative analysis of 27 data sets from public data repositories, such as TCGA and the HPA, as well as experimental data (Supplementary Fig. 6). a Detailed hierarchy of NUDIX clusters represented with a dendrogram and a heat map. Shown are distances between vector representations of NUDIX enzymes. b Integrative clustering analysis of the NUDIX enzymes. Enzymes in the same cluster are linked with undirected edges in the network, colored based on the epistasis score. The substrate activity data is added to the same network, relating clusters of NUDIX enzymes. c, d Effect of siRNA-mediated knockdowns of NUDT5 and NUDT9 on the mRNA expression levels of the interrogated NUDIX genes in A549 and MCF7 cells. e Cluster of NUDT4, NUDT5, NUDT6, NUDT7, NUDT8, and NUDT9, which is the largest identified by the integrated analysis. f Similarities between members of the interrogated cluster reveal internal structure of the cluster. Darker color indicates greater similarity. g, h When integrating 11 data sets that were related in A549 cell line, NUDT4, NUDT5, and NUDT6 were clustered together, but placed in a different cluster than NUDT7, NUDT8, and NUDT9. Heat map showing similarity of vector representations of the enzymes, whereby these representations were derived from the model of 11 data sets describing A549 data. i, j Similar to g, h, but in this case 10 data sets originated from MCF7 cells were considered for the clustering

