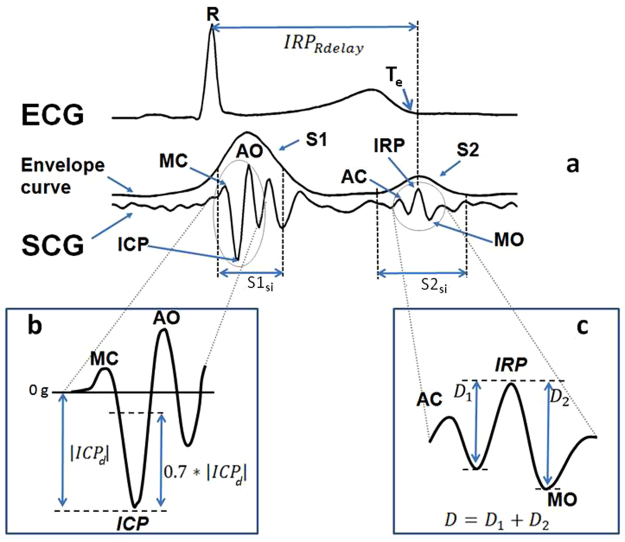
Figure 5.
Scheme of FP identification. Panel a: ECG with the indication of the Te point, SCG with its envelope curve and indication of the S1 and S2 areas, MC, AO, AC and MO fiducial points, ICP and IRP anchor points and definition of the IRPRdelay used for the AC and MO identification. Inset b: definition of the threshold points used for the estimation of MC and AO in the S1si window. Inset c: definition of the D1 and D2 distances used for the scoring of the peaks in the S2si window for the identification of the IRP anchor point used for the localization of AC and MO.

