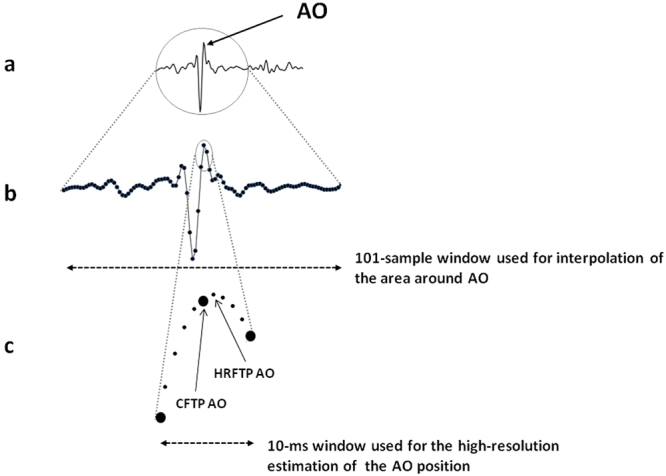
Figure 8.

Schematization of the signal interpolation and re-sampling for the 1-ms resolution assessment of FPs. In this representation the FP considered is AO. Panel a: the entire SCG waveform. Panel b: detail of the data window used for the interpolation. Panel c: the small data window used for the hi-res localization of AO, the larger circles represent the original low resolution samples and the smaller circles the final high resolution samples, CFTP = Coarse FP Time Position, HRFTP = Hi-Res FP Time Position.
