Fig. 4.
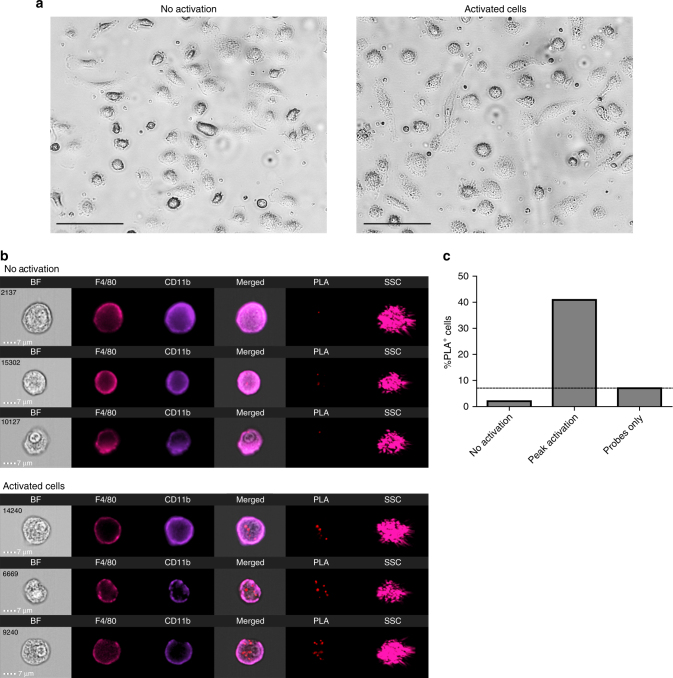
PLIC analysis of caspase-1 oligomerization in NLRP3 inflammasome-activated bone-marrow derived macrophages (BMDM). a Light microscopy images (x20) of non-activated BMDM and NLRP3 inflammasome-activated (LPS + ATP) BMDM. Scale bar 100 μM b Representative images of non-activated and NLRP3 inflammasome-activated BMDM, detected by PLIC, depicting median cells of the PLA bright detail intensity, and the PLA max pixel features. Cells are presented as (left to right): bright field (BF), staining of F4/80 (PE/Cy7), CD11b (PB), BF/PLA/F4/80/CD11b overlay (merged), PLA (FarRed), and side scatter (SSC). Scale bar 7 μM. c Quantitative analysis of caspase-1 oligomerization (presented as the percentage of PLA+ cells) in non-activated cells, cells at peak activation, and probes only control. Representative of four independent experiments with similar results, calculated from 20,000 cells (F4/80+CD11b+) per treatment (no activation/ NLRP3 inflammasome activation by LPS + ATP)

