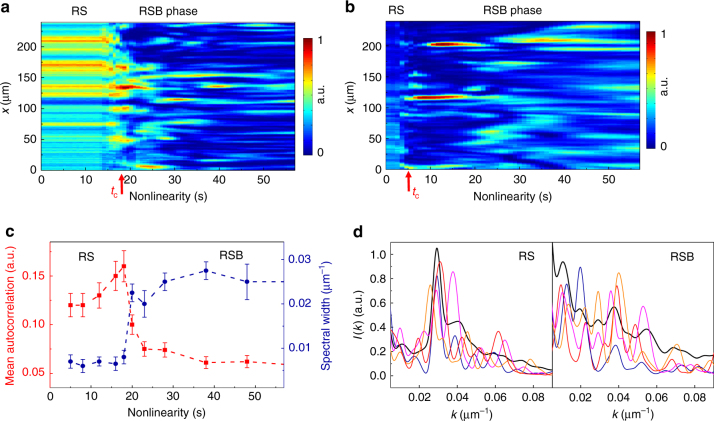
Fig. 2.
Loss of spatial coherence and shot-to-shot fluctuations. a, b Detected intensity distributions I(x) at the slab output for increasing nonlinearity and input powers a P = 0.2 mW, b P = 5 mW. Both observations show a dynamic phase transition at t c (marked by a red arrow) to a spatially incoherent state. c Width of the Fourier spectrum and mean intensity autocorrelation as a function of the nonlinearity for the case in a. Dashed lines serve to guide across the transition. Error bars are given by the finite-size of the imaged area. d Sample of shot-to-shot flucutations of the spectral intensity: single-shot spectra (color lines) and averaged spectrum (black line) at s and at s. Replica symmetric (RS) and replica symmetry breaking (RSB) phases are indicated

