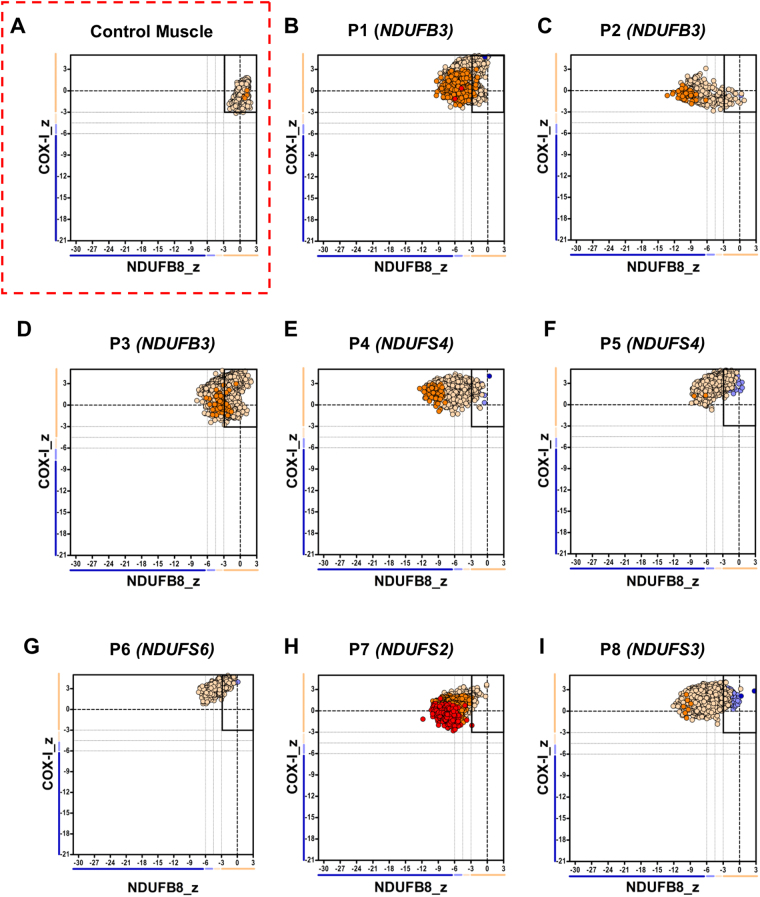
Figure 1.
Mitochondrial respiratory chain expression profile linking complex I, complex IV and porin levels in patients with isolated Complex I deficiency caused by defects in nuclear-encoded Complex I subunits. Graphs show complex I and complex IV expression profile from (A) Normal adult control and patients with (B–D) homozygous c.64T>C, p.(Trp22Arg) NDUFB3 variant, P1–n = 4372 fibres analysed, P2–n = 559, P3–n = 13422 (E) compound heterozygous NDUFS4 variant, P4, n = 5964 (F) Homozygous exon 3 and 4 deletion in NDUFS4, P5, n = 4683 (G) homozygous NDUFS6 variant, P6, n = 880 (H) Homozygous NDUFS2 variant, P7, n = 5337 (I) Homozygous NDUFS3 variant, P8, n = 7154. Each dot represents a single muscle fibre, colour co-ordinated according to its mitochondrial mass: very low – blue, low – light blue, normal – beige, high – orange, very high - red. Black dashed lines represent the SD limits for the classification of the fibres. Lines adjacent to X and Y axis represent the levels of NDUFB8 and COX-1: beige: normal (<−3), light beige: intermediate (+) (−3 to −4.5), light blue: intermediate (−) (−4.5 to −6) and blue: deficient (>−6). Bold dashed lines indicate the mean expression level of normal fibres.

