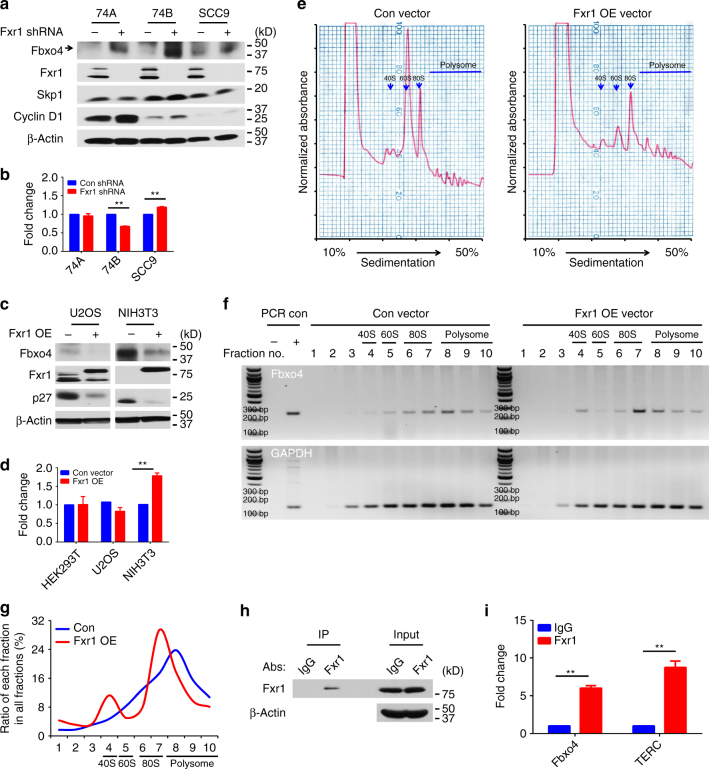
Fig. 6.
Negative feedback regulation of Fbxo4 by Fxr1. a Fbxo4 protein levels upon Fxr1 knockdown in 74A, 74B and SCC9 cells. b Fbxo4 mRNA levels upon Fxr1 knockdown in 74A, 74B and SCC9 cells. c Fbxo4 protein levels upon ectopic Fxr1 expression in U2OS and NIH3T3 cells. d Fbxo4 mRNA levels upon ectopic Fxr1 expression in HEK293T, U2OS and NIH3T3 cells. e Polysome profile in NIH3T3 cells with Fxr1 overexpression. f DNA gel shows the RT-PCR products from serial polysome fractions. g Quantitative distribution of Fbxo4 mRNA from (f). h Western blot from immunoprecipitation of Fxr1 in RIP analysis. i RIP analysis indicates Fxr1 interacts with Fbxo4 mRNA. TERC mRNA is used as positive control. All the data represent mean ± s.d. and were analysed by Student’s t test (n = 3). **p < 0.01

