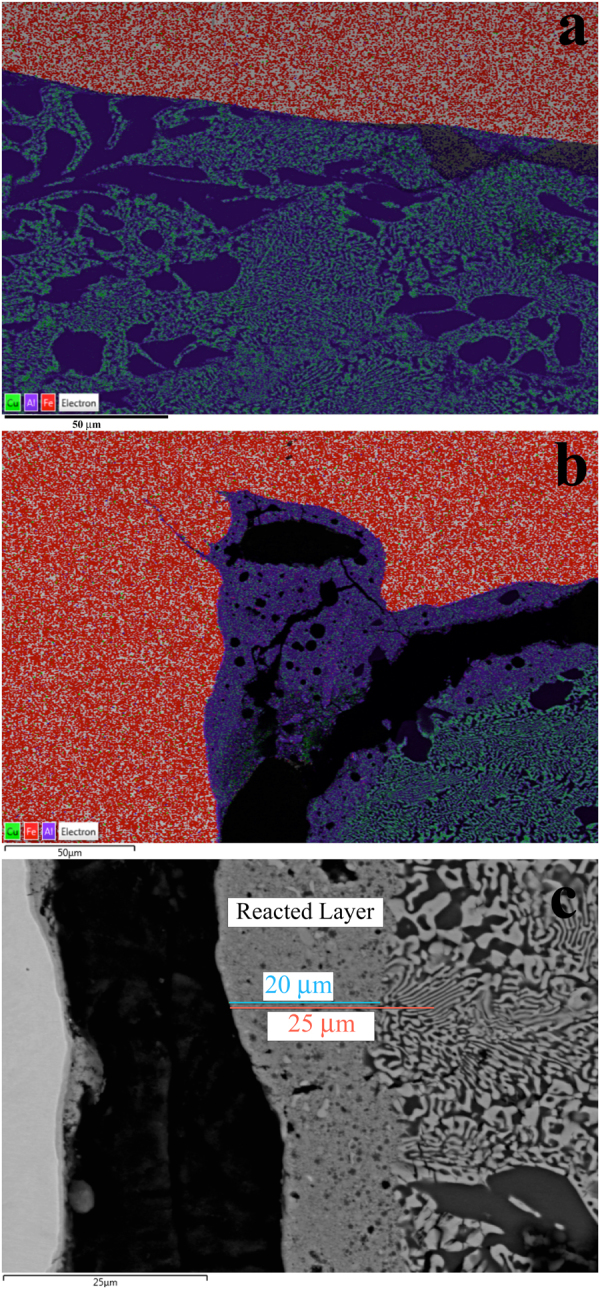
Figure 3.

Experiment S1234. (a) X-ray intensity map overlain on backscattered electron image, showing a segment of the rear wall of the capsule (green box in Fig. 2). The color scheme is shown at lower-left: Cu is green, Al is purple, Fe is red. Cu-Al alloys are blue-green. Most of the interface is sharp, without evidence of mixing or reaction, except for two patches at right, enlarged in Fig. 5 (ROI 2) that indicate the presence of Fe in a portion of what was originally the CuAl5 layer. (b) A similar map of the corner formed by the rear wall and the lateral edge of the sample chamber (red box in Fig. 2, also shown in Fig. 4). There is a larger region of mixing and reaction (blue). (c) Back-scattered electron image of a segment of the left lateral wall of the sample chamber (blue box in Fig. 2). The bright area at far left is the SS304 chamber wall. The black area is missing material, lost during sample preparation. The eutectoid region at far right is the typical texture of the CuAl5 alloy. The 20 μm wide band down the center of the image is a fine-grained reacted zone containing Cu, Al, and Fe.
