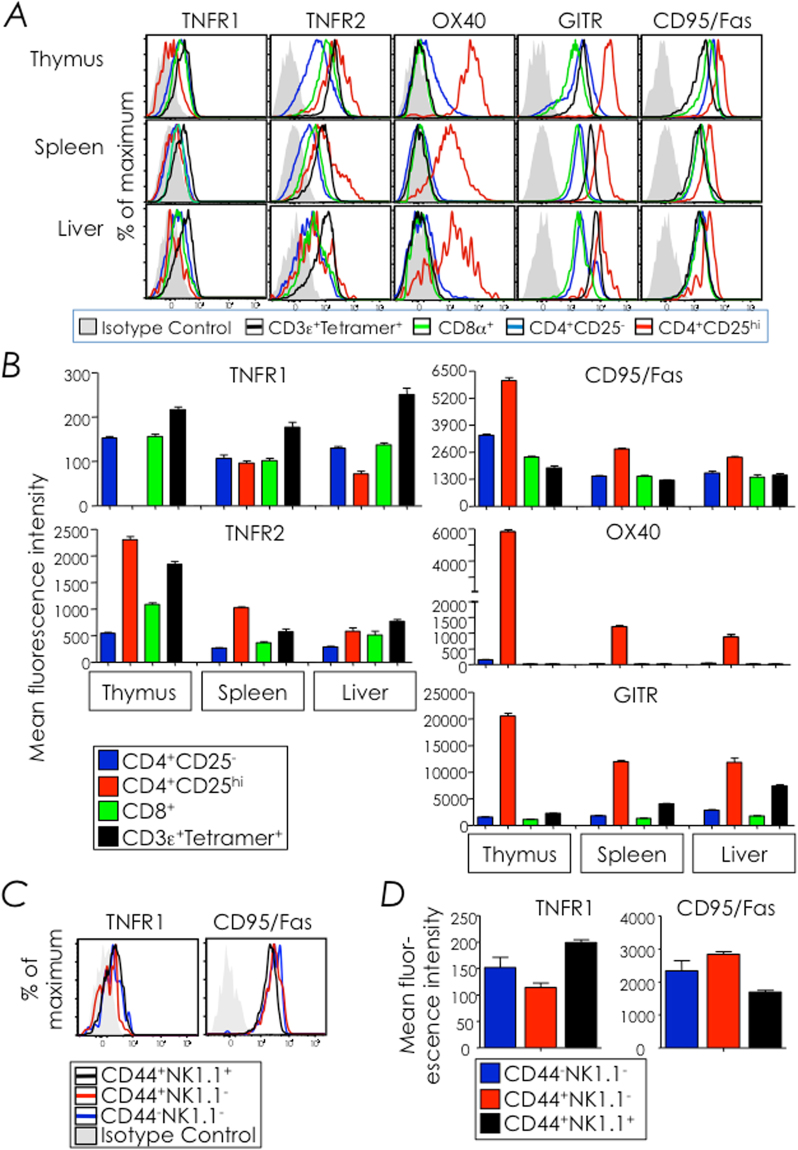
Figure 4.
NKT cells constitutively express TNFR1 and Fas (CD95). (A,B) The expression of TNFR1, TNFR2, OX-40, GITR and Fas (CD95) by thymic, splenic, and hepatic NKT cells, CD4+CD25+, CD4+CD25hi and CD8+ cells was determined by flow cytometry after surface staining with specific mAb and corresponding isotype control mAb. NKT cells from C57BL/6 (n = 9) mice were identified as CD3ε+tetramer+ cells within electronically gated CD8lo thymocytes or B220lo splenocytes. CD4+ and CD8+ T cells from mice were identified as CD4+ or CD8+ cells within electronically gated thymocytes or B220lo CD3ε+tetramerneg splenocytes and hepatic leukocytes. CD4+ T cells were further gated to identify CD4+CD25− and CD4+CD25hi cells. (A) Overlays show expression of the tested TNFRSF member on different T cell subsets. Filled grey histogram are representative isotype controls; note that all T cell subsets had nearly similar isotype control staining and, therefore, the staining of isotype control in CD4+CD25− is overlaid here. (B) Difference in mean fluorescence intensity (ΔMFI) between specific mAb and corresponding isotype control staining on each T cell subset is plotted as mean ΔMFI ± sem; n and replicates as in A. (C,D) TNFR1 and Fas expression on thymic stage 0 + 1, stage 2 and stage 3 NKT cells was determined by flow cytometry after surface staining as in A. Thymic NKT cell developmental stages were identified as in Fig. 1. (C) Filled grey histograms are isotype controls; note that isotype control for stage 3 NKT cells are shown here as stage 1 and stage 2 NKT cells showed similar isotype control staining intensity. Representative of 3 independent experiments; n = 3 mice/experiment. (D) A plot of mean ΔMFI ± sem, computed as in B; n and replicates as in C.

