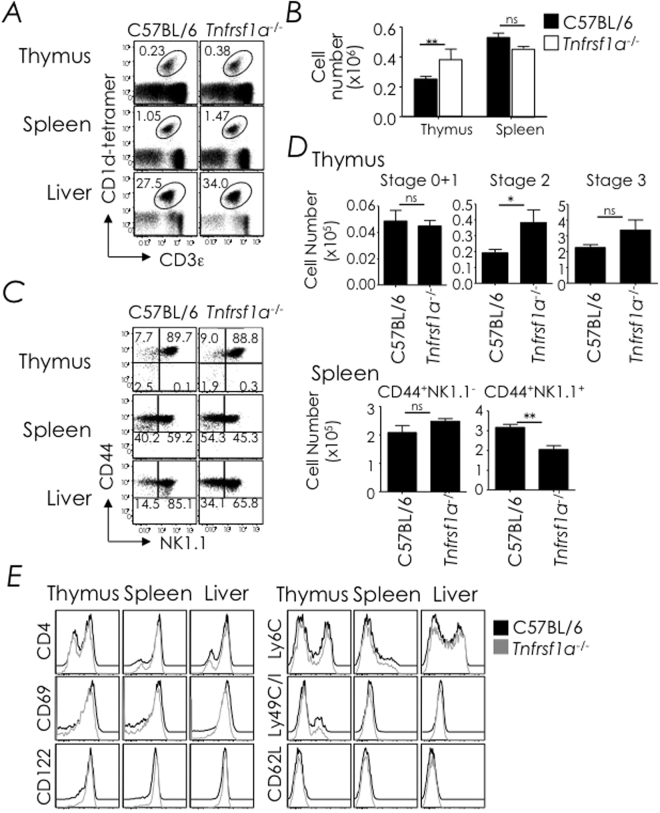
Figure 6.
TNFR1-deficiency does not impact NKT cell development. (A) Thymic, splenic and hepatic NKT cells from C57BL/6 (n = 5) and B6.129-Tnfrsf1a −/− (n = 5) mice were identified as CD3ε+tetramer+ cells within electronically gated CD8lo thymocytes or B220lo splenocytes. Numbers are % NKT cells among total leukocytes within each organ. (B) Absolute cell numbers were calculated from % NKT and total cell count. Data are mean ± sem from 3 independent experiments; n, as in A. (C) Thymic NKT cell developmental stages were identified as in Fig. 1 or NKT cells were identified as splenic and hepatic NK1.1-tetramer+ or NK1.1+tetramer+ cells. Numbers are % cells among total NKT cells. n, as in A. (D) Absolute numbers of thymic (upper panel) stage 0 + 1, stage 2 and stage 3 NKT cells and absolute numbers of splenic (lower panel) CD44+NK1.1NEG and CD44+NK1.1+ NKT cells; they were calculated from the absolute NKT cell numbers in B and % stage 0 + 1, stage 2 and stage 3 cells or CD44+NK1.1NEG and CD44+NK1.1+ cells in C. n, as in A. Data are mean ± sem from 3 independent experiments. (E) Expression of CD4, CD69, CD122, Ly6C, Ly49C/I, and CD62L by thymic, splenic, and hepatic NKT cells was determined by flow cytometry after surface staining with specific mAb. Data are representative of 2 independent experiments. n, as in A. ns, not significant (P > 0.05), *P ≤ 0.05, **P ≤ 0.001.

