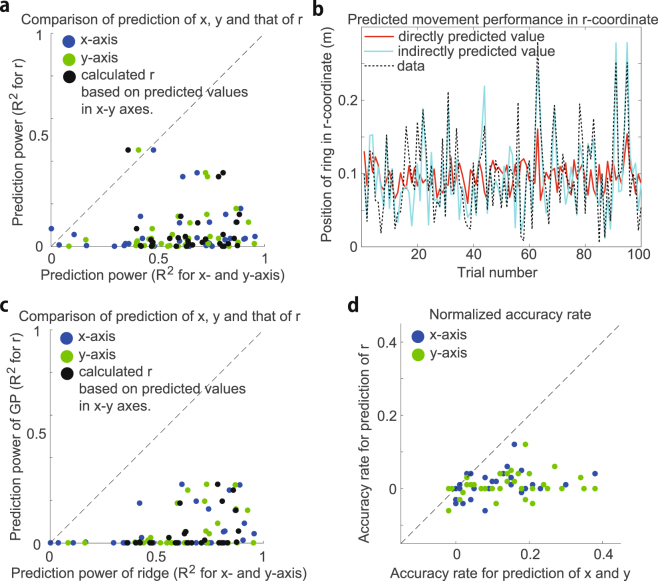
Figure 5.
Comparison of the predicted movement performance on the x- and y-axes and r-coordinates. (a) for the predicted movement performance on the x- (blue dots) and y-axes (green dots) and r-coordinates (data in r-coordinates were calculated as ). Each dot indicates in each session. The black dots indicate for the predicted movement performance in r-coordinates and that in r-coordinates by calculating using the predicted performance on the x- and y-axes. (b) Predicted performance in r-coordinate by directly applying ridge regression in the r-coordinate (red line) and indirectly calculating the predicted performance on the x- and y-axes (cyan line). The black dotted line indicates actual data in the r-coordinate. (c) Predictive power of movement performance in the r-coordinate by Gaussian process regression, a nonlinear method. The horizontal axis indicates for the predicted movement performance on the x-axis (blue dots) and the y-axis (green dots) using ridge regression, and the vertical axis indicates that in the r-coordinate using the Gaussian process. The black dots indicate the same values as in (a). (d) Normalized accuracy rate for the prediction of movement performance on the x-axis (blue dots), y-axis (green dots), and r-coordinates by logistic regression, a classification method. The normalized accuracy rate was calculated by subtracting the accuracy rate at the 1st time bin from that at the 12th time bin.

