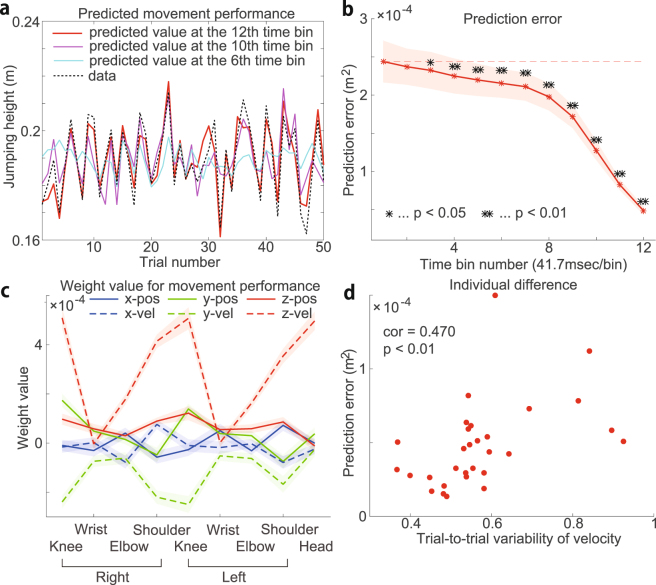
Figure 6.
Detection of the relevance of each motion element to performance in the jumping experiment. (a) Predicted jumping height using ridge regression at the 12th time bin (red line), the 10th time bin (magenta line), and the 6th time bin (cyan line). The black dotted line indicates the jumping height data. (b) Relation between the prediction error and time bin. The red asterisks indicate the averaged prediction error across 30 sessions. The shaded areas indicate the standard error. The prediction error in each session was evaluated by 10-fold cross-validation using the optimized regularization parameter . The black asterisks indicate significant differences at the level of p 0.01 (double black asterisks) or p 0.05 (single black asterisk) in the Wilcoxon signed-rank test between the prediction error at the time bin and that with and . (c) The estimated weight values at the 12th time bin. The solid and dotted lines indicate the averaged across all sessions with respect to position and velocity, respectively. The x-, y-, and z-coordinates are shown in blue, green, and red, respectively. The shaded areas indicate the standard error of . (d) Relation between the trial-to-trial variability in the non-normalized velocity data and prediction error at the 12th time bin. The variability and prediction error were correlated with each other (r = 0.47 and p 0.01 on the x- and y-axes).

