Figure 4.
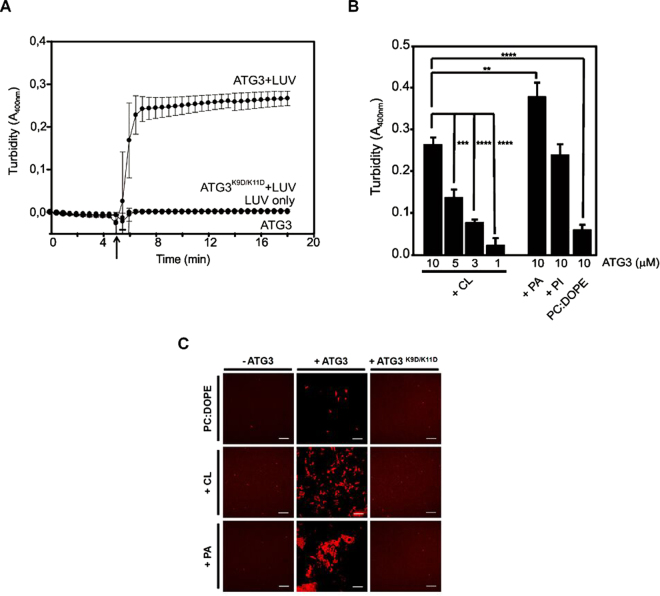
ATG3-promoted vesicle aggregation. (A) Time-course of 3 mM LUV (PC:DOPE:CL 60:30:10 mol ratio) aggregation induced by 10 μM ATG3. Arrow indicates addition of ATG3. Each curve represents the mean ± SE (n = 3). Note that data for ATG3, for LUV only and for ATG3 K9D/K11D + LUV overlap. (B) Effect of lipid composition and ATG3 concentration on LUV aggregation. Bars represent mean ± SE (n = 3) of ΔA400. ***P ≤ 0.001, **P ≤ 0.01, *P ≤ 0.05 of unpaired t-test. (C) Representative images of ATG3-induced aggregation of LUV of different lipid compositions: PC:DOPE (70:30 mol ratio), PC:DOPE:CL (60:30:10 mol ratio) or PC:DOPE:PA (50:30:20 mol ratio). Scale bars: 30 μm.

