Figure 8.

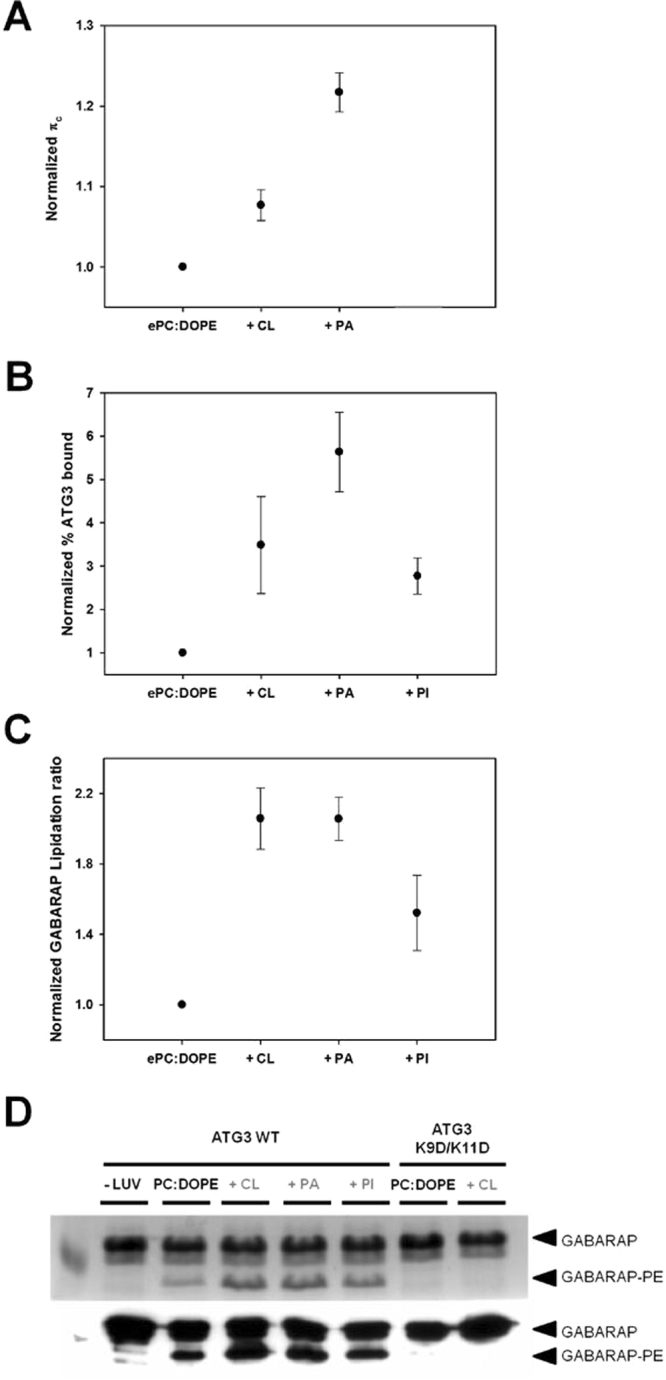
ATG3 governs GABARAP lipidation ratio. (A) ATG3 binding to lipid monolayers. Data from Fig. 2C normalized to the PC:DOPE value. (B) ATG3 binding to liposomes of different lipid compositions. Data from Fig. 3C normalized to PC:DOPE. (C) GABARAP lipidation ratio using different lipid compositions. Data obtained from gels as shown in D normalized to the PC:DOPE value. Average values of two experiments. (D) Coomassie blue staining (upper panel) and anti-GABARAP Western blotting (lower panel) of the in vitro lipidation reaction using different lipid compositions. Lipid compositions are detailed in each panel. Black arrow heads indicate lipidated and non-lipidated forms of GABARAP. Full-length blots/gels are presented in Supplementary Figure 3.
