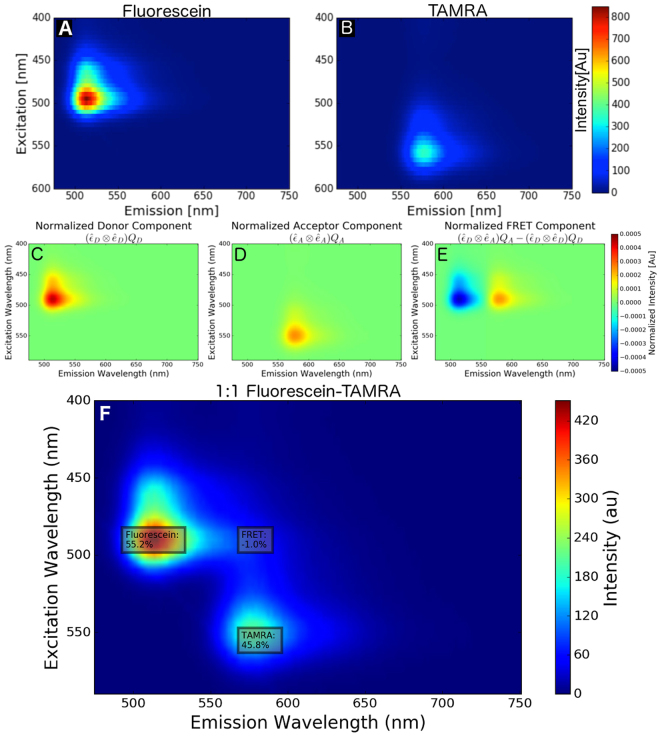
Figure 4.
Measured EEM of Fluorescein and TAMRA solutions at 2 M concentration in PBS, (A) and (B) respectively. Donor, Acceptor, and FRET components used for linear unmixing were generated from the normalized excitation and emission spectra as shown in (C), (D), and (E), respectively. Panel F shows the EEM of a 1:1 mixture of the Fluorescein and TAMRA solutions with the relative magnitudes of the fitting components superimposed (Donor: 55.2%, Acceptor: 45.8%, FRET: −1.0%)

