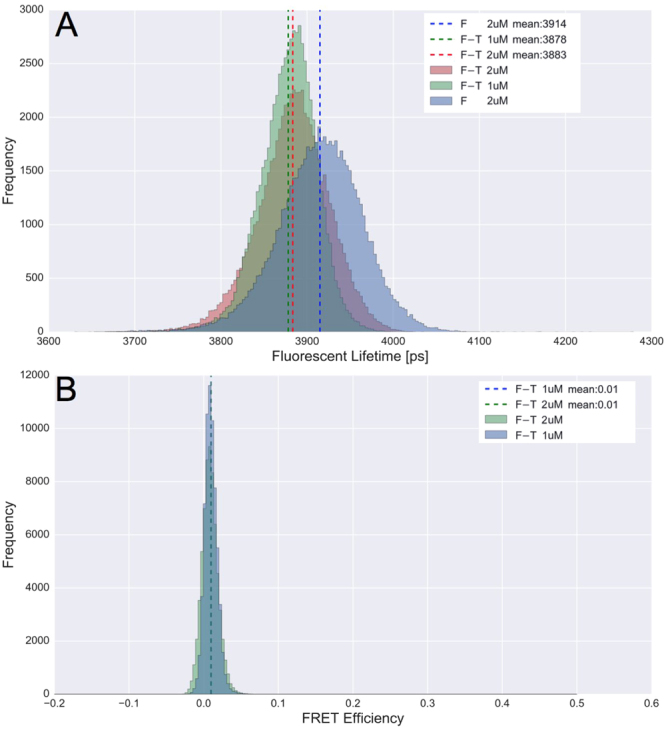
Figure 5.

Fluorescein and TAMRA Fluorescent Lifetime and FRET Efficiency Distributions: Lifetimes were captured on an inverted microscope using time-correlated single photon counting (TCSCP). (A) Fluorescent lifetime distributions for Fluorescein (F-Blue), Fluorescein and TAMRA at 1 M (F-T-1uM-Green) and Fluorescein and TAMRA at 2 M (F-T-2uM-Red). Means of the lifetime distributions are shown as vertical dotted lines corresponding to the histogram color with averages printed in the legend. (B) FRET efficiency for 1 and 2 M mixtures based on the lifetime distributions in (A), calculated according to equation (7).
