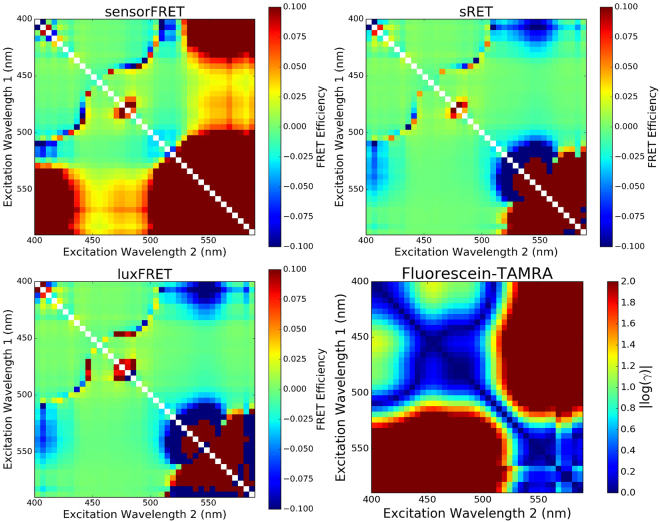
Figure 6.
Excitation Pairing Matrices: Excitation-emission recordings shown in Fig. 4F were used to generate pairs of emission spectra at two different excitation frequencies: ,, where F 1 is the spectra at excitation frequency 1, the fixed excitation frequency 1, and the entire emission spectrum. Each pair of spectra were used as inputs into the spectral unmixing algorithms (LuxFRET, sRET, and SensorFRET). Every possible paired input spectra were used to output an estimated FRET efficiency that is color coded in each matrix. Ideally, all pixels would register 0% FRET (green), however certain excitation pairs have either poor signal to noise ratios or . sRET and LuxFRET showed identical error sensitivity to various input frequencies and SensorFRET showed slightly less error tolerance. All algorithms fail at the red-edge of the spectrum where donor signal was absent or where gamma is near unity.

