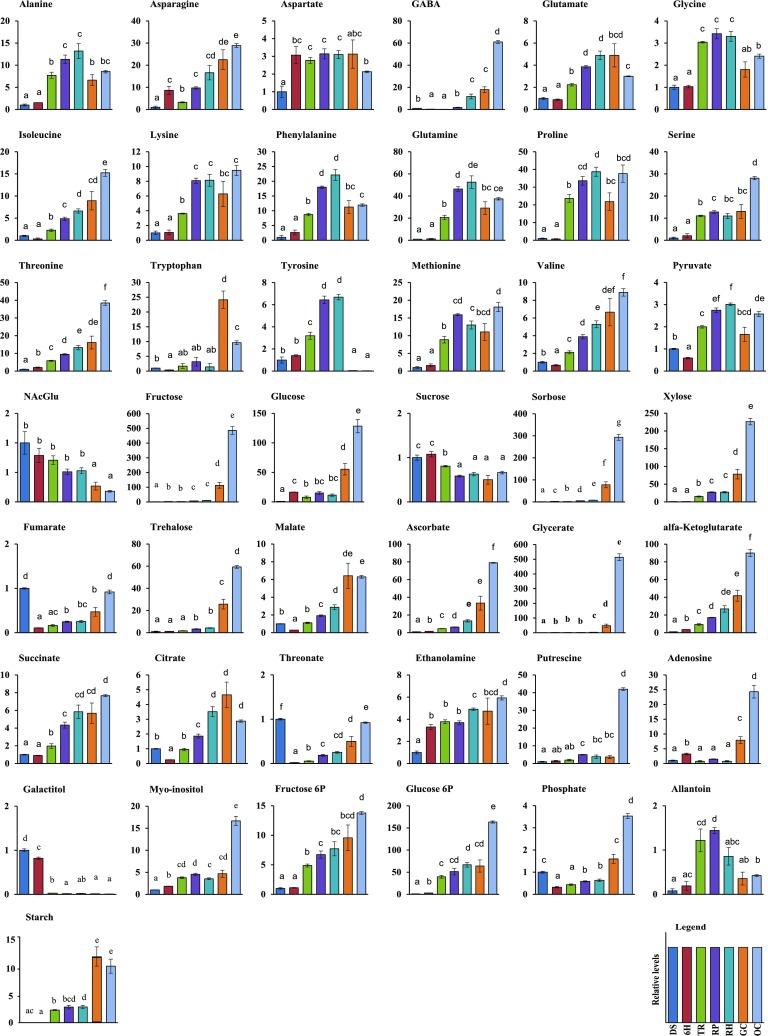
Fig. 2.

Relative concentration of 42 metabolites and starch which showed statistically significant variation during the seed-to-seedling transition. Different lower case letters above bars represent differences between samples by Tukey’s HSD (p < 0.05). Colours of bars refer to developmental stages. From left to right: DS dry seed, 6H six hours imbibed, TR testa rupture, RP radicle protrusion, RH root hair, GC greening cotyledons, and OC cotyledons fully opened
